Zcash (ZEC) pumped hard, but it hasn’t been able to hold up near the highs. Price is now stalling, and the chart is starting to look weak again.
Crypto analyst Cryptorphic shared a clear warning on ZEC, saying that the real move may still be down. His take is that Zcash is stuck under a major resistance level, buyers are losing energy, and the market is starting to look more like distribution than strength.
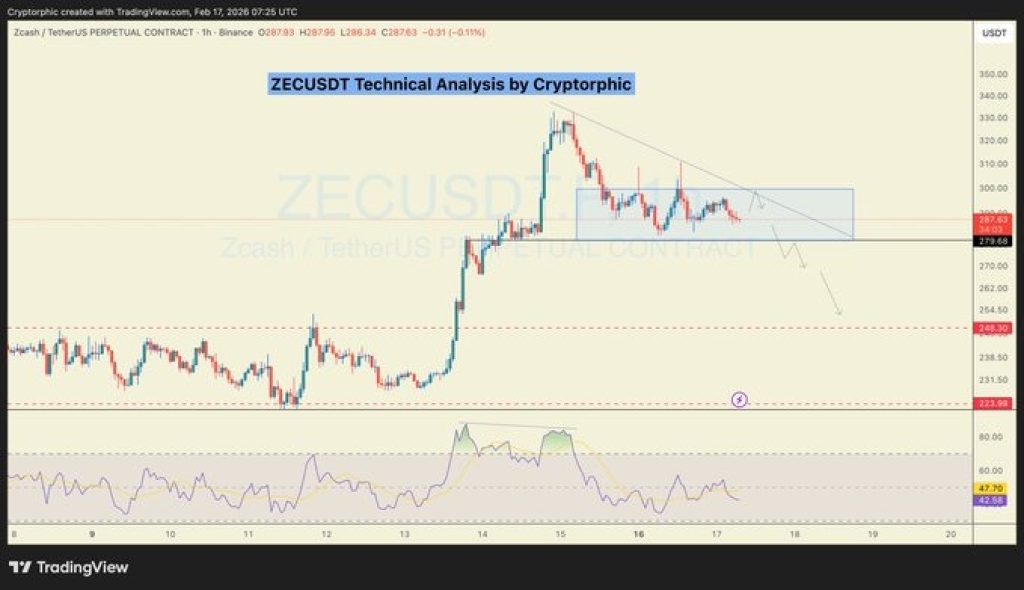
The first thing that stands out on the ZEC chart is the $300 zone. Zcash pushed into that area after the pump, but it failed to break through cleanly.
ZEC has been stuck below that level for days, and every bounce keeps losing strength. Sellers are clearly holding the line, and buyers aren’t pushing back hard enough.
As long as ZEC stays capped under $300, upside becomes limited and the risk of a deeper pullback grows.
Meanwhile, Cryptorphic highlights $281 as the most important support level right now, and the chart backs that up.
The Zcash price is sitting near the lower edge of the current range, and price action is tightening. This is the kind of zone where a breakdown can happen quickly if buyers step aside.
If ZEC loses $281, the structure breaks, and the chart opens up space toward the next major support.
Source: X/Cryptorphic
$255 Could Come Fast on a Breakdown For ZEC
The next downside target sits around $255. That level is marked clearly on the chart as the next support area below the range.
If $281 fails, there is not much in between to slow the move down. That’s why Cryptorphic says the door opens toward $255 fast.
This is where traders start paying close attention, because range breakdowns often trigger sharp follow-through selling.
_****XRP Manipulation Fears Rise as Analyst Flags Potential Liquidation Trap for Retail**
However, the RSI indicator on the chart is also rolling over. After the pump, momentum peaked, but it has been fading since then.
RSI is now drifting lower, which fits with the idea that buying strength is cooling off. When momentum fades near resistance, price often struggles to push higher. That adds more weight to the bearish outlook in the short term.
Zcash Price Outlook
Zcash delivered a strong pump, but the chart now looks heavy. Price is stuck below $300, support at $281 is under pressure, and momentum is fading.
Cryptorphic’s analysis points to a clear scenario: if the ZEC price breaks below $281, a drop toward $255 becomes the next logical move.
Until buyers reclaim $300 with strength, Zcash remains in a fragile spot, and this looks more like distribution than a fresh breakout phase.
Disclaimer: The information on this page may come from third parties and does not represent the views or opinions of Gate. The content displayed on this page is for reference only and does not constitute any financial, investment, or legal advice. Gate does not guarantee the accuracy or completeness of the information and shall not be liable for any losses arising from the use of this information. Virtual asset investments carry high risks and are subject to significant price volatility. You may lose all of your invested principal. Please fully understand the relevant risks and make prudent decisions based on your own financial situation and risk tolerance. For details, please refer to
Disclaimer.
Related Articles
Dogecoin Sees Rising Long Bets While Price Stays Under Pressure
Dogecoin's long positioning increases as traders expect a rebound, yet significant short positions and declining trading volume suppress price movement. The market lacks direction, showing a sideways to slightly bearish outlook as the price struggles to gain momentum.
CryptoNewsLand46m ago
Dogecoin Eyes Breakout as Bollinger Bands Signal Price Shift
Key Insights:
Dogecoin trades near resistance as Bollinger Bands tighten, signaling reduced volatility and an increasing likelihood of a sharp directional price movement soon.
Declining trading volume reflects market hesitation, yet reduced selling pressure may still support upward
CryptoNewsLand52m ago
ETH 15-minute rise of 0.58%: large on-chain transfers strengthen liquidity, and combined with easing ETF selling pressure, it lifts spot buying demand
2026-04-07 17:30 to 17:45 (UTC), over the past 15 minutes ETH’s return was +0.58%. The price ranged from 2085.28 to 2115.38 USDT, with a swing of 1.44%. Trading activity was active during this period; market attention rose quickly, short-term fluctuations intensified, and capital flow liquidity increased noticeably.
The main driving force behind this unusual move was that large on-chain transfers were concentrated and occurred around the same time. Some long-term holdings were transferred to exchange addresses, greatly boosting market liquidity and causing an increase in the depth of spot buy orders. In addition, the trend of ETF fund outflows was significantly reduced in this window
GateNews1h ago
Chainlink Price Holds Steady as $9.75 Resistance Draws Focus
Key Insights
Chainlink trades within a defined range as a neutral RSI and steady volume create conditions for a potential breakout once momentum strengthens in the coming sessions.
Resistance at $8.89 remains critical as a confirmed move above this level could push the price toward the
CryptoNewsLand1h ago
Cardano Holds Key Support as Whale Activity Signals Shift
Key Insights:
Whale accumulation increased steadily since March, with large holders absorbing supply near lows while retail activity remained subdued during weak price action phases.
Stablecoin liquidity on Cardano doubled year over year, strengthening market depth and supporting stronger
CryptoNewsLand1h ago
“Insiders Dumping Everything Except Oil” Claim Hits Tape: BTC, PI, And XRP Reaction
A viral post claimed insiders were liquidating assets except for oil, reflecting traders' concerns about geopolitical tensions and macroeconomic stress. The narrative highlights oil's resilience amid cautious sentiment in crypto markets like BTC and XRP, impacted by factors like Trump's Iran threats.
LiveBTCNews2h ago
