SUI trades near $0.97 ahead of Grayscale’s GSUI ETF launch on NYSE Arca, with weekly gains of 10% and rising open interest.
SUI price is trading near key resistance levels as Grayscale prepares to launch its Sui Staking ETF under the ticker GSUI.
The token has posted steady weekly gains, and traders are watching whether the ETF debut could drive further price movement.
SUI Records Weekly Gains Ahead of ETF Launch
SUI traded around $0.97 on Wednesday after a modest daily increase of less than 1%.
Over the past seven days, the token has gained about 10%, reflecting gradual upward momentum.
The broader crypto market has also shown signs of recovery. Bitcoin traded above $68,000, while Ethereum hovered near the $2,000 level.
Other major altcoins such as Solana, XRP, and Dogecoin recorded mild gains during the same period.
SUI has remained above the $0.90 support zone in recent sessions. Market participants are monitoring whether sustained trading above $0.98 could support additional upside pressure.
Grayscale’s GSUI ETF Set for NYSE Arca Trading
Grayscale Investment confirmed that its Sui Staking ETF will begin trading on NYSE Arca under the ticker GSUI.
The launch follows an 8-A filing with the US Securities and Exchange Commission, which became effective automatically.
Grayscale Sui Staking ETF (Ticker: $GSUI) offers investors direct exposure to $SUI. 💧 $GSUI starts trading tomorrow on @NYSE Arca. pic.twitter.com/HzhTyAd3pd
— Grayscale (@Grayscale) February 18, 2026
The ETF is designed to provide regulated exposure to the SUI token. Investors will gain access to SUI price performance and potential staking rewards through a traditional exchange-traded product structure.
The fund carries a management fee of 0.35%, though Grayscale stated that the fee will be waived for the first three months.
The waiver remains in place until assets under management reach $1 billion. The launch adds another crypto-linked ETF to US markets.
**Related Reading: **$143M in Short Liquidations Stack Above SUI – What Happens Next?
Technical Indicators and Price Levels in Focus
SUI recently tested resistance near the $1.20 level after stabilizing above $1.00. Analysts are observing whether the token can break above this resistance and approach the $1.50 range.
The Relative Strength Index stands near 52, which suggests moderate bullish momentum without entering overbought territory. Meanwhile, the Moving Average Convergence Divergence indicator shows the short-term line approaching the signal line.
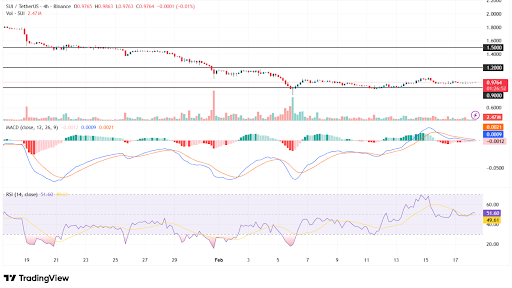
SUI consolidates near resistance as momentum cools. Source: TradingView
Open interest in SUI derivatives rose by 0.82% to about $512.65 million. The increase suggests growing trading activity as the ETF launch approaches.
Traders continue to monitor the $0.90 support level, as a break below that area could shift short-term price direction.
Disclaimer: The information on this page may come from third parties and does not represent the views or opinions of Gate. The content displayed on this page is for reference only and does not constitute any financial, investment, or legal advice. Gate does not guarantee the accuracy or completeness of the information and shall not be liable for any losses arising from the use of this information. Virtual asset investments carry high risks and are subject to significant price volatility. You may lose all of your invested principal. Please fully understand the relevant risks and make prudent decisions based on your own financial situation and risk tolerance. For details, please refer to
Disclaimer.
Related Articles
Crypto Market Sees Continuous Downturn As Geopolitical Tensions Grow
The global crypto market is down 1.60% to $2.38T amidst escalating U.S.-Iran tensions, with Bitcoin and Ethereum experiencing declines. Notably, some smaller cryptocurrencies have surged. DeFi and NFT sectors show mixed trends, while regulatory developments emerge.
BlockChainReporter22m ago
Where Could Kaspa (KAS) Price Go This Week?
Kaspa (KAS) is showing serious resilience even as its price remains near lows. Kaspa’s hash rate is holding near all-time highs, showing miners aren’t stepping back and the network’s backbone is rock solid.
A major hardfork is coming on May 5, bringing native tokens and more programmability.
CaptainAltcoin40m ago
19.81% Surge for DUSK: What It Means for Traders
DUSK's price surged 19.81% to $0.09667 amid increased market activity and a broader altcoin shift. Analysts highlight its rising relevance and key resistance at $0.10, suggesting significant future trading interest.
Coinfomania55m ago
Bitcoin Briefly Falls Below $70,000 Mark During Asian Session as Fed Hawkishness and Macro Uncertainty Weigh on Market Volatility
Bitcoin dipped below $70,000 on March 19th, touching a low of approximately $69,537, reflecting the market's reassessment of the Federal Reserve's interest rate decision and inflation outlook. Although it later rebounded to around $70,180, the $70,000 level remains a key support in the near term. With weakening market sentiment, coupled with energy prices and macro risks, capital is turning more conservative, and Bitcoin may consolidate around the $70,000 level going forward.
区块客2h ago
XRP Enjoying 'Strong Retail Demand,' Report Says - U.Today
The essay explores the contrasting dynamics between retail and institutional demand in the cryptocurrency market. It highlights XRP's strong retail base and growing adoption, while institutional interest remains cautious, especially compared to assets like Bitcoin and Ethereum, amid recent ETF flows.
UToday2h ago
Fractal model predicts Bitcoin will hit bottom in October 2026
Bitcoin shows positive recovery signals, improving market sentiment after a long phase of volatility. However, experts believe the current uptrend is short-term, with deeper correction risks ahead. According to Crypto Rover's fractal model, Bitcoin's price follows a four-year cycle influenced by halving events. The current cycle likely peaked in late 2025, with further declines expected before a potential bottom around 2026. Short-term price fluctuations can mislead investors, emphasizing the importance of understanding these cycles for long-term trends.
TapChiBitcoin2h ago
