
Key Takeaways
-
BTC swept $60K, triggering $1.31B in liquidations.
-
2018 fractal pattern hints at a relief bounce forming.
-
$72K–$78K emerges as near-term upside relief bounce target.
The crypto market just went through another brutal shakeout.
**Bitcoin (BTC) **briefly revisited the October 2024 demand zone near $60,000 before rebounding toward $66,000, still down roughly 5.6% on the day and nearly 28% over the past month. The selloff triggered heavy forced closures, with $1.31 billion in BTC liquidations alone in the last 24 hours — a clear sign that over-leveraged longs were flushed out.
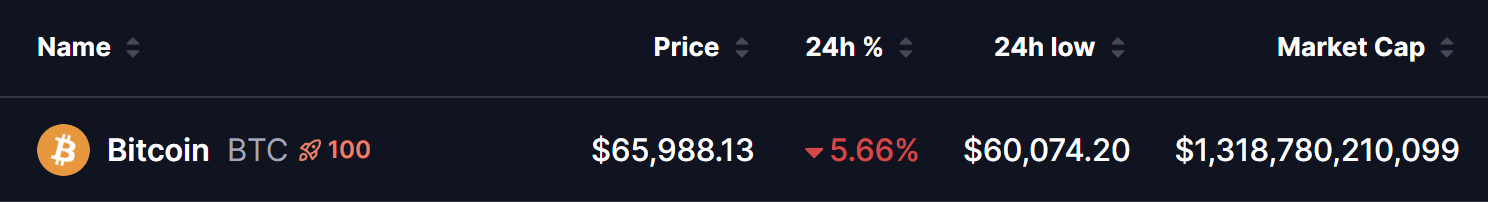
Source: Coinmarketcap
But while price action looks ugly on the surface, something interesting is forming beneath it.
Fractal Suggests a Relief Bounce
According to analysis shared by crypto analyst CryptoBullet, Bitcoin is now printing a structure that closely resembles the 2018 post-cycle-top fractal — a period that first delivered a sharp capitulation, followed by a meaningful relief bounce.
Back in 2018, BTC crashed hard after topping, found a local bottom, and then rallied aggressively for several weeks before rolling over again. Fast forward to today, and the 2026 chart is showing a remarkably similar rhythm:
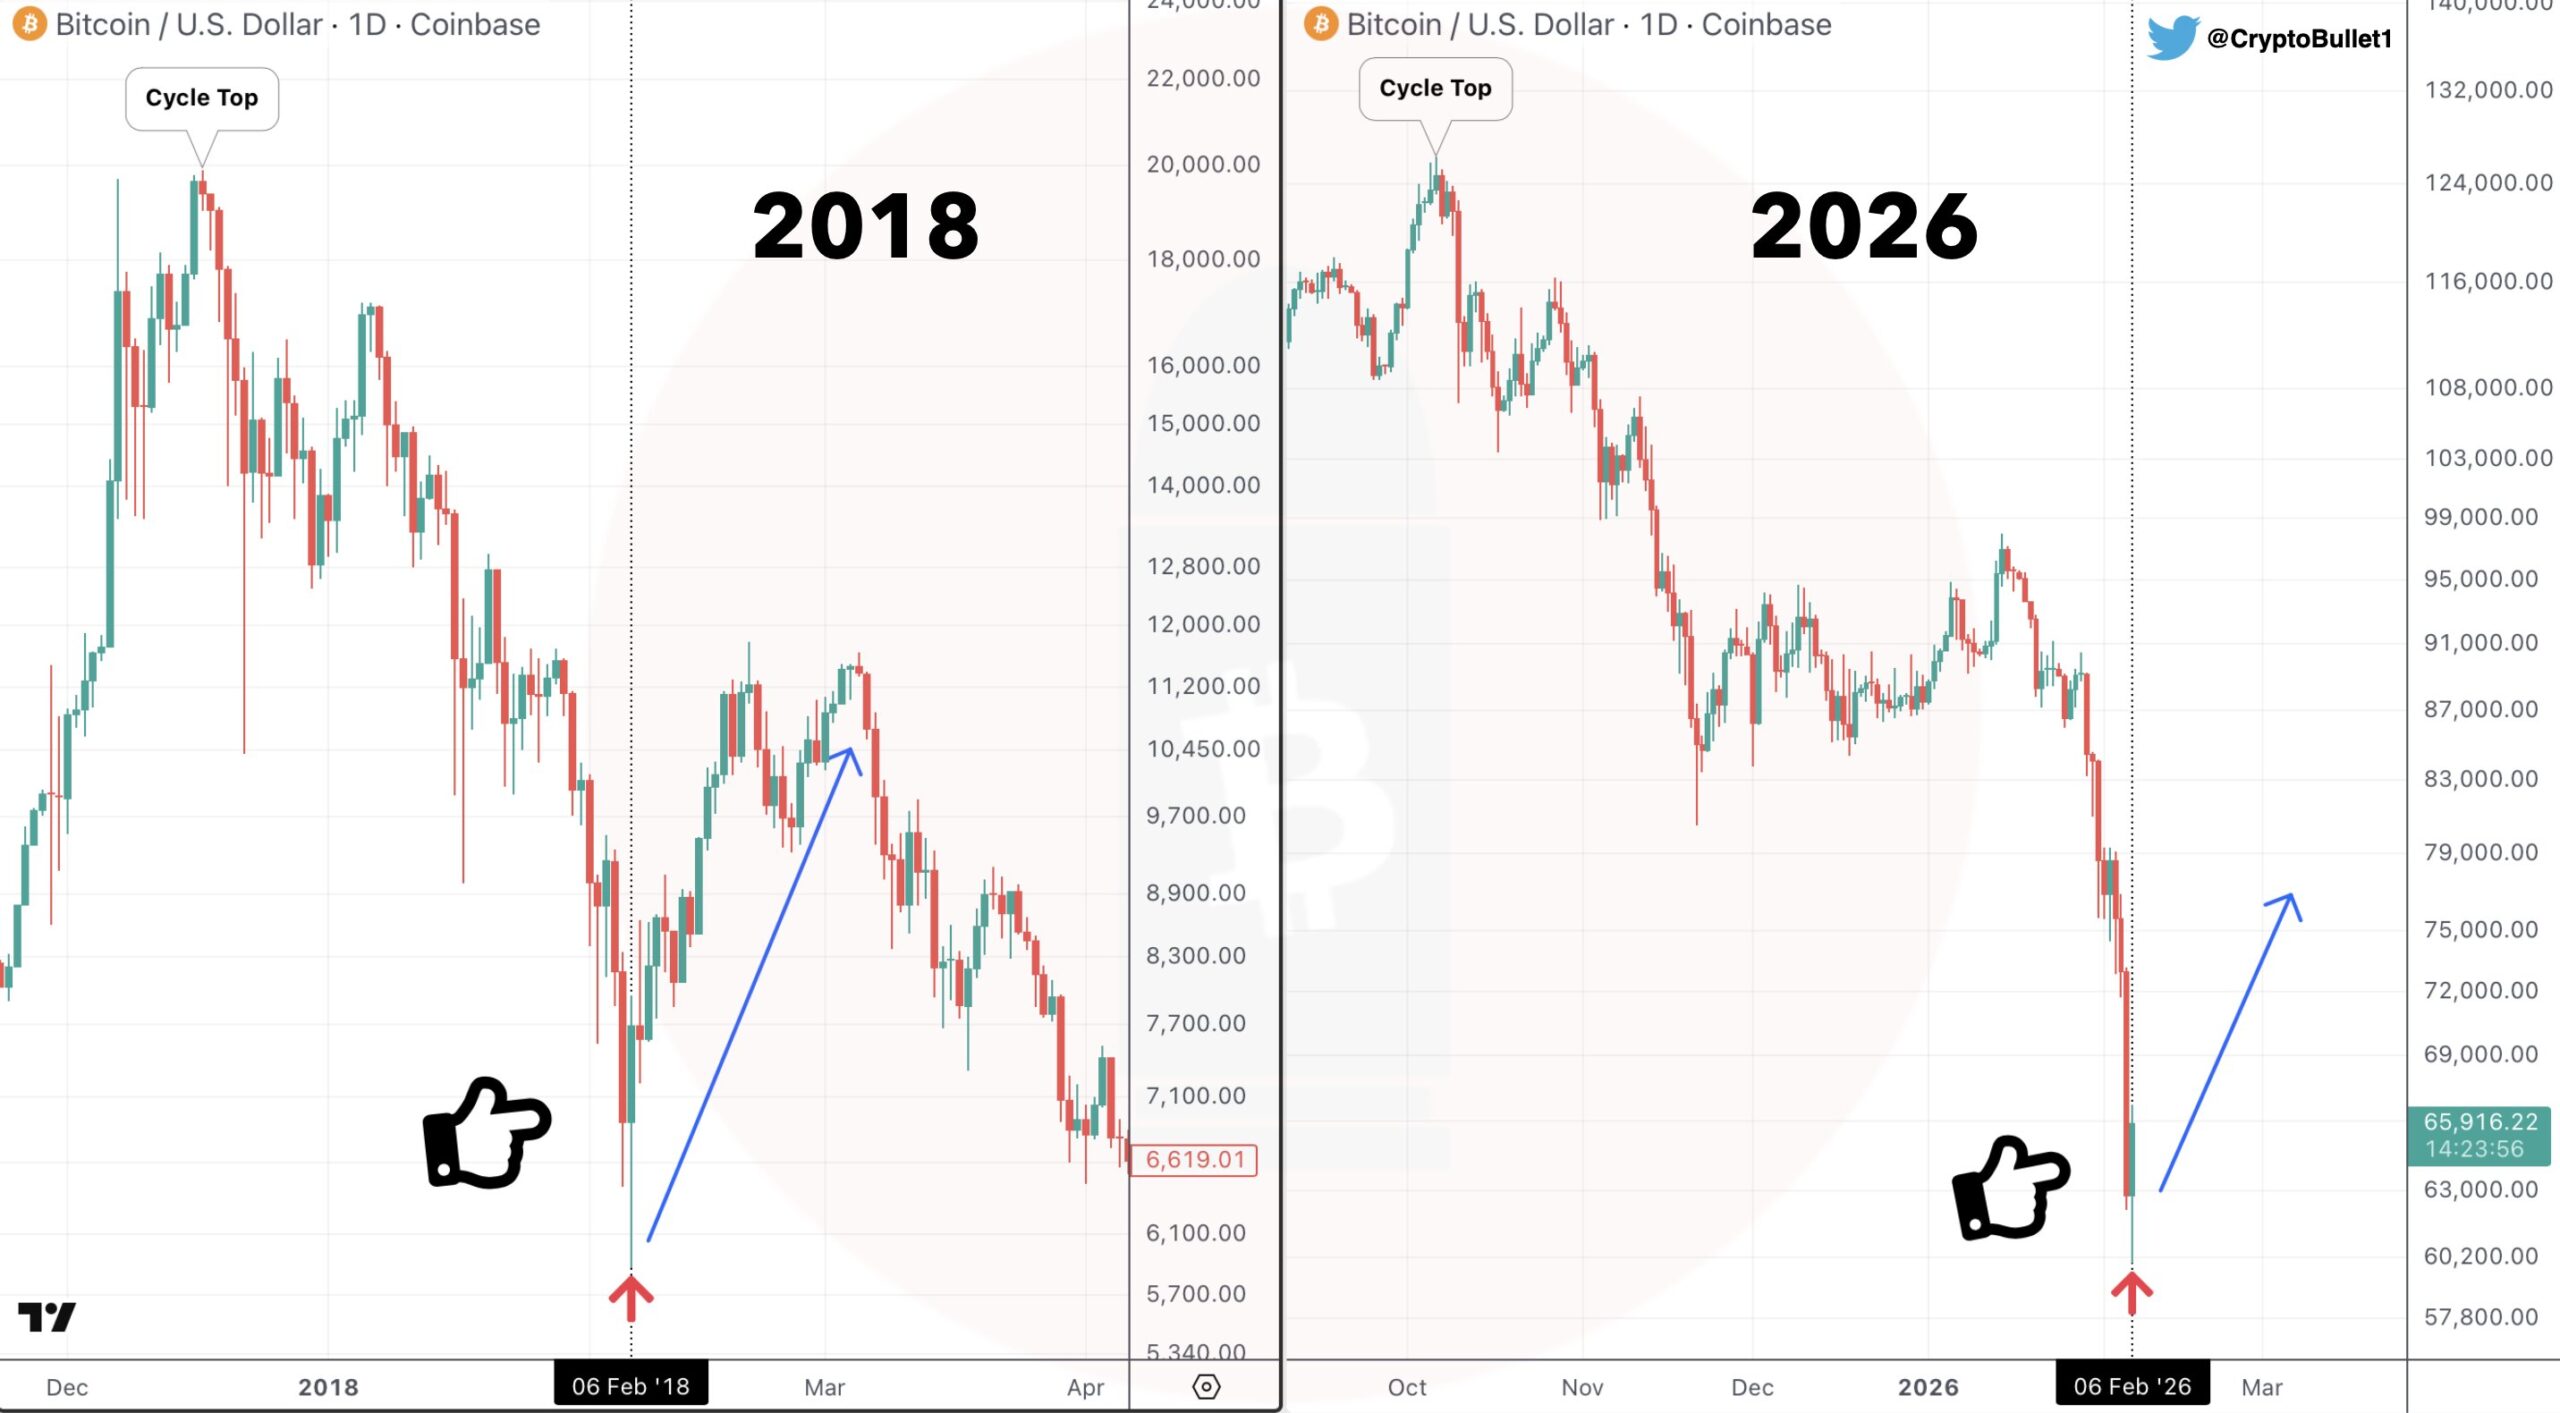
BTC Fractal Chart/Credits: @CryptoBullet1
In both cases, that first violent flush acted as a reset for leverage — clearing the path for a temporary upside move.
This doesn’t automatically mean a new bull leg is starting. But historically, these kinds of capitulation candles often mark short-term exhaustion, opening the door for a relief rally.
Bounce zone forming on higher timeframe
Zooming out to the 3-day chart, BTC has now tapped a confluence support area highlighted as a “bounce zone” — aligning with:
-
The prior high-volume POC region
-
A 1.618 Fibonacci extension from the recent swing
-
Completion of a potential ABC corrective structure
This is exactly the type of area where short-term buyers tend to step in, especially after a liquidation-heavy move like the one we just saw.
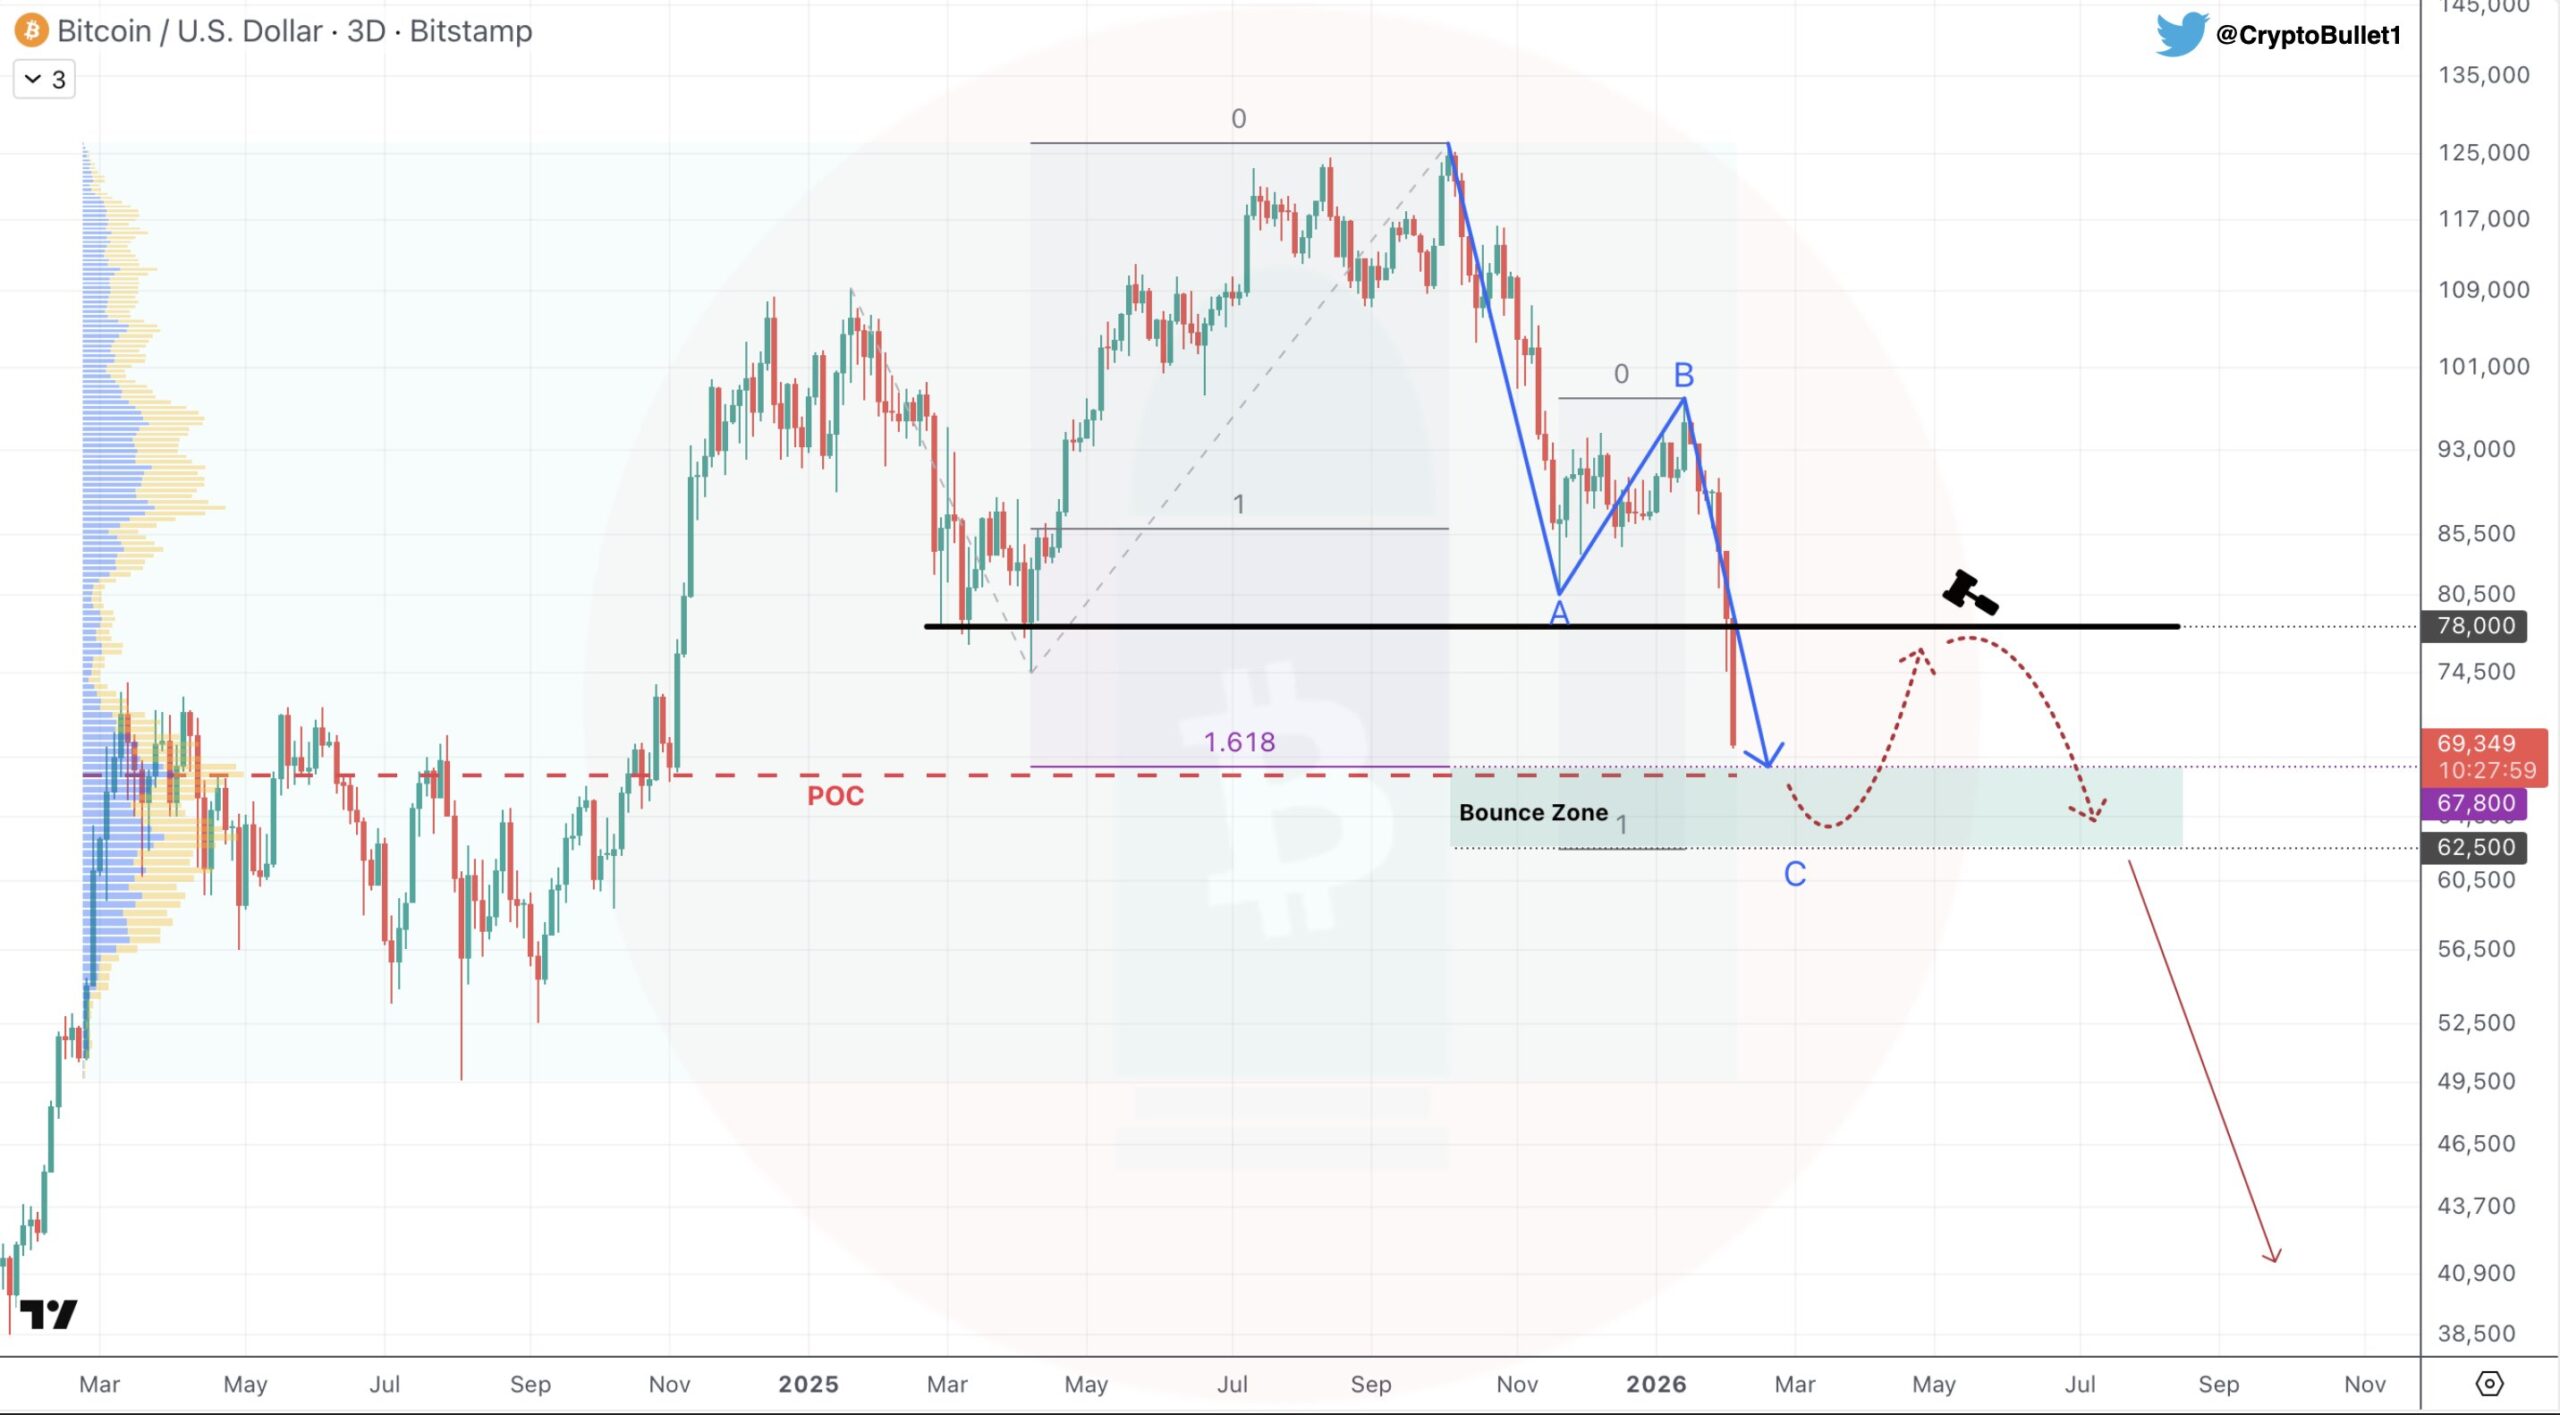
Bitcoin (BTC) 3 Day Chart/Credits: @CryptoBullet1
CryptoBullet’s roadmap suggests that if this level holds, Bitcoin could attempt a recovery back toward the mid-$70K region, with $78K emerging as a key upside target for a relief bounce.
That would also line up nicely with the 2018 fractal, where BTC rallied sharply after its first major flush — even though the broader downtrend later resumed.
What’s next for BTC?
If this fractal continues to play out, Bitcoin may already be in the early stages of a dead-cat bounce / relief rally. A push toward $72K–$78K isn’t unrealistic, especially now that a large chunk of leverage has been wiped from the system.
However, it’s important to keep expectations grounded.
Relief bounces during bearish phases often come with:
If buyers fail to reclaim higher levels convincingly, BTC could still roll over later and revisit deeper supports.
For now, the market appears to be reacting to capitulation conditions, and history suggests that usually brings at least a temporary upside pause.
In simple terms: the panic selling may be done for the moment — and Bitcoin could be setting up for a short-term rebound, even if the larger trend remains uncertain.
Disclaimer: The views and analysis presented in this article are for informational purposes only and reflect the author’s perspective, not financial advice. Technical patterns and indicators discussed are subject to market volatility and may or may not yield the anticipated results. Investors are advised to exercise caution, conduct independent research, and make decisions aligned with their individual risk tolerance.
About Author: Nilesh Hembade is the Founder and Lead Author of Coinsprobe, with over 5 years of experience in the cryptocurrency and blockchain industry. Since launching Coinsprobe in 2023, he has been providing daily, research-driven insights through in-depth market analysis, on-chain data, and technical research.
Disclaimer: The information on this page may come from third parties and does not represent the views or opinions of Gate. The content displayed on this page is for reference only and does not constitute any financial, investment, or legal advice. Gate does not guarantee the accuracy or completeness of the information and shall not be liable for any losses arising from the use of this information. Virtual asset investments carry high risks and are subject to significant price volatility. You may lose all of your invested principal. Please fully understand the relevant risks and make prudent decisions based on your own financial situation and risk tolerance. For details, please refer to
Disclaimer.
