
The LINK price is starting to catch traders’ interest again, and honestly, it makes sense. After months of grinding lower, Chainlink is now sitting right near the bottom of a major macro range, and that’s usually where things start getting interesting.
Crypto expert Lucky summed up the mood perfectly with a simple question: is $LINK quietly getting ready for a comeback? And when you look at the charts, it’s not hard to see why that idea is floating around again.
- Monthly Chart Shows LINK Price Still Stuck in a Massive Range
- Daily Chart: LINK Price Is Sitting Right in a Demand Zone
- LINK Price Outlook: Quiet Setup or Something Bigger Brewing?
Monthly Chart Shows LINK Price Still Stuck in a Massive Range
On the monthly timeframe, the LINK price has basically been trapped in a huge consolidation zone for years now. The chart shows that impulse move into the 2021 peak, followed by a long stretch of sideways action where price has been capped inside a broad range.
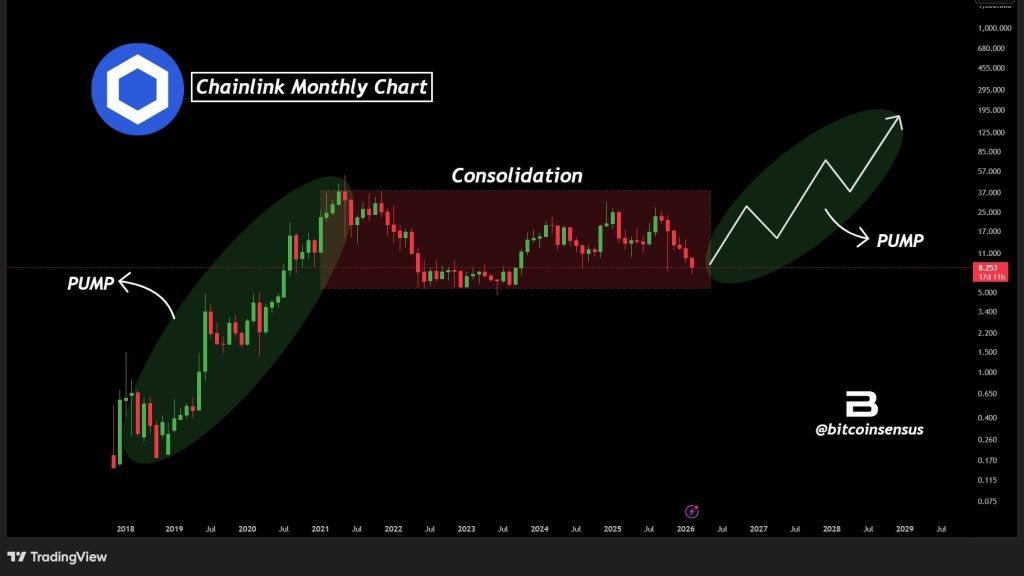
Source: X/@Bitcoinsensus
The key detail is where LINK sits right now, near the lower end of that range. That’s important because these lower range zones are often where price compresses before the next major expansion phase begins.
Bitcoinsensus pointed out this same structure, calling it a macro consolidation that may be nearing its end. The idea is pretty simple: big impulse, long reset, then eventually the next wave higher once the range finally breaks.
Daily Chart: LINK Price Is Sitting Right in a Demand Zone
Zooming into the daily chart shared by Lucky, the LINK price is sitting inside a clear demand zone after months of downtrend pressure. That falling resistance line has controlled price for a long time, but now LINK is compressing right near support, which is usually where sellers start losing their grip.
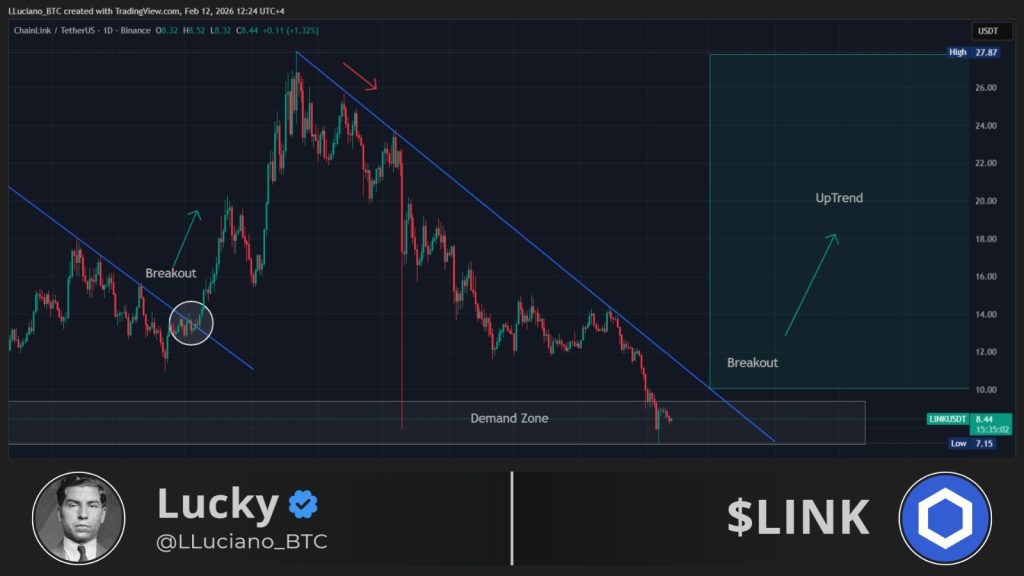
Source: X/@LLuciano_BTC
The chart also highlights a breakout area above the downtrend line, and if the LINK price can reclaim momentum and push out of this base, the upside starts opening up quickly. The target zone on the chart stretches toward the $20–$27 region, which would be a full recovery move back into the upper structure.
Top Analyst Says Chainlink (LINK) Price Could 17x From Here – The $100 Chart Setup Explained_**
LINK Price Outlook: Quiet Setup or Something Bigger Brewing?
Right now, the LINK price is still in the “boring” phase of the cycle, that part where everything feels slow right before it stops being slow. Macro consolidation near range lows, compression on the daily chart, and a clear breakout trigger overhead are exactly the kind of setup traders like to spot early.
If LINK breaks out of its downtrend and starts reclaiming higher levels, this could turn into one of those comeback charts people only appreciate after the move is already gone. For now, Chainlink is sitting at a major decision point. And the next move could end up being a lot bigger than it looks today.
Disclaimer: The information on this page may come from third parties and does not represent the views or opinions of Gate. The content displayed on this page is for reference only and does not constitute any financial, investment, or legal advice. Gate does not guarantee the accuracy or completeness of the information and shall not be liable for any losses arising from the use of this information. Virtual asset investments carry high risks and are subject to significant price volatility. You may lose all of your invested principal. Please fully understand the relevant risks and make prudent decisions based on your own financial situation and risk tolerance. For details, please refer to
Disclaimer.
Related Articles
RAVE, SIREN Rally Despite Manipulation Warnings
Rave DAO and Siren tokens surged to near all-time highs, facing volatility and liquidation risks. Concerns grew over potential market manipulation and supply concentration, particularly for RAVE. A new KuCoin listing boosted RAVE's visibility, despite inherent trading risks.
CryptoFrontier18m ago
ETH rises 0.65% in 15 minutes: ETF fund inflows and leverage long accumulation resonate to lift spot prices
Between 2026-04-17 09:15 and 2026-04-17 09:30 (UTC), ETH fluctuated within the 2351.53 to 2376.99 USDT range. The 15-minute return recorded +0.65%, with a swing of 1.08%. Within this range, buying pressure significantly strengthened, with trades dominated by medium-sized orders, which increased market attention and amplified short-term volatility.
The main drivers behind this anomaly are continued inflows of institutional capital into ETH spot ETFs, especially with cumulative net inflows over the past 4 days exceeding $212 million. On April 17 alone, the ETF added an additional $9.5 million in inflows, and spot buy orders expanded in sync within 15 minutes. Leveraged long positions in the derivatives market are the second-largest catalyst. From April 14 to 17, ETH futures open interest grew 26% week over week, indicating that capital via multiple paths is simultaneously betting on an upside move. The funding rate being neutral suggests the leveraged structure is temporarily healthy.
In addition, global macro market risk appetite has rebounded (geopolitical tensions easing, and the Federal Reserve keeping rates unchanged), driving a broad rebound across mainstream risk assets, and the crypto market has attracted liquidity accordingly. At the industry level, major financial institutions are advancing filings for ETFs and trust products. Mining companies have increased their ETH holdings and also maintained active staking activity, further reinforcing medium- to long-term market expectations. Multiple factors overlap and resonate, amplifying volatility. On-chain transfers remain generally stable, and there is no abnormal concentration of fund flows migrating between exchanges.
What needs attention is that although the current market is lifted by the resonance of institutional capital and leverage, the continuous growth of futures positions combined with the spot price failing to rise above the 2400 USDT area will bring the risk of forced liquidation. Meanwhile, if ETF subscription inflows slow down or macro liquidity reverses, ETH spot support could weaken. Please focus on tracking ETF net inflows, changes in futures open interest, the macro news backdrop, and nearby support and resistance levels, and stay alert to short-term volatility and potential abrupt adjustments. For more real-time market information, please keep watching.
GateNews37m ago
BTC up 0.58% in 15 minutes: exchange net outflows and ETF buy orders converge to lift the price
Between 2026-04-17 08:45 and 2026-04-17 09:00 (UTC), the BTC price surged in the short term. The candlestick return was +0.58%, with a price range of 75265.0 - 75862.3 USDT and a range of 0.79%. Market volatility increased and attention rose, with trading volume significantly higher than usual, reflecting a convergence between capital flow and technical signals.
The main driver behind this unusual move is the exchange’s net outflow of BTC in sync with ETF capital inflows. Data shows that within the past 24 hours, exchanges recorded a net outflow of 2,844.68 BTC
GateNews1h ago
Citi Study: Bitcoin and Gold Together Outperform Single Asset Allocation in Long-Term Portfolios
A Citi study recommends combining Bitcoin and gold in investment portfolios for improved long-term returns, noting better performance in various market conditions. Wells Fargo predicts gold could rise to $8,000 by 2027, driven by central bank concerns. Meanwhile, Bitcoin funding rates have reached lows, historically marking turning points.
GateNews1h ago
ETF Launch Fails to Stem Tide As XRP Sinks to $1.81, Lowest Since April
Crypto asset manager Bitwise’s launch of a spot XRP exchange-traded fund on Nov. 20 failed to lift the token, which fell to $1.81 — its weakest level since April — before a broader Nov. 21 sell‑off drove monthly losses above 20%.
ETF Launch Followed by Double-Digit Losses
The highly
Coinpedia1h ago
PENGU’S at a Crossroad: $0.008 Supply Zone Signals Major Move Ahead
PENGU shows steady accumulation with strong whale participation and controlled upward momentum.
Spot and futures markets align, supporting a broader and healthier uptrend.
$0.008 supply zone acts as key resistance defining the next major price move.
Pudgy Penguins entered a decisive mome
CryptoNewsLand1h ago
