Bitcoin Cash (BCH) is currently one of the few cryptocurrencies in the top 10 with a weekly price chart trending upward. Meanwhile, BNB was once considered a potential next candidate but has been under heavy pressure, experiencing a 54% decline over the past four months.
In contrast, BCH has maintained trading within a stable range for nearly 20 months. The price range fluctuates from $272 to $640, offering many attractive opportunities for swing traders.
According to a report from Coinphoton, long-term investors expect this range’s high to be broken and turned into support before considering participation in a stronger bullish trend. Although buyers attempted a breakout in early January, this effort was unsuccessful due to a market-wide sell-off that caused the price to reverse and correct.
However, currently, the Bitcoin Cash network appears to be maintaining a stable state. The significant increase in transaction volume along with active whale movements recently indicates strong on-chain liquidity circulation.
Short-term traders focus on the middle of the range to predict the next move
Since the second week of October, BCH price has touched below the support level in the middle of the $456 range three times on the weekly timeframe. However, no weekly close has fallen below this level, keeping the outlook positive.
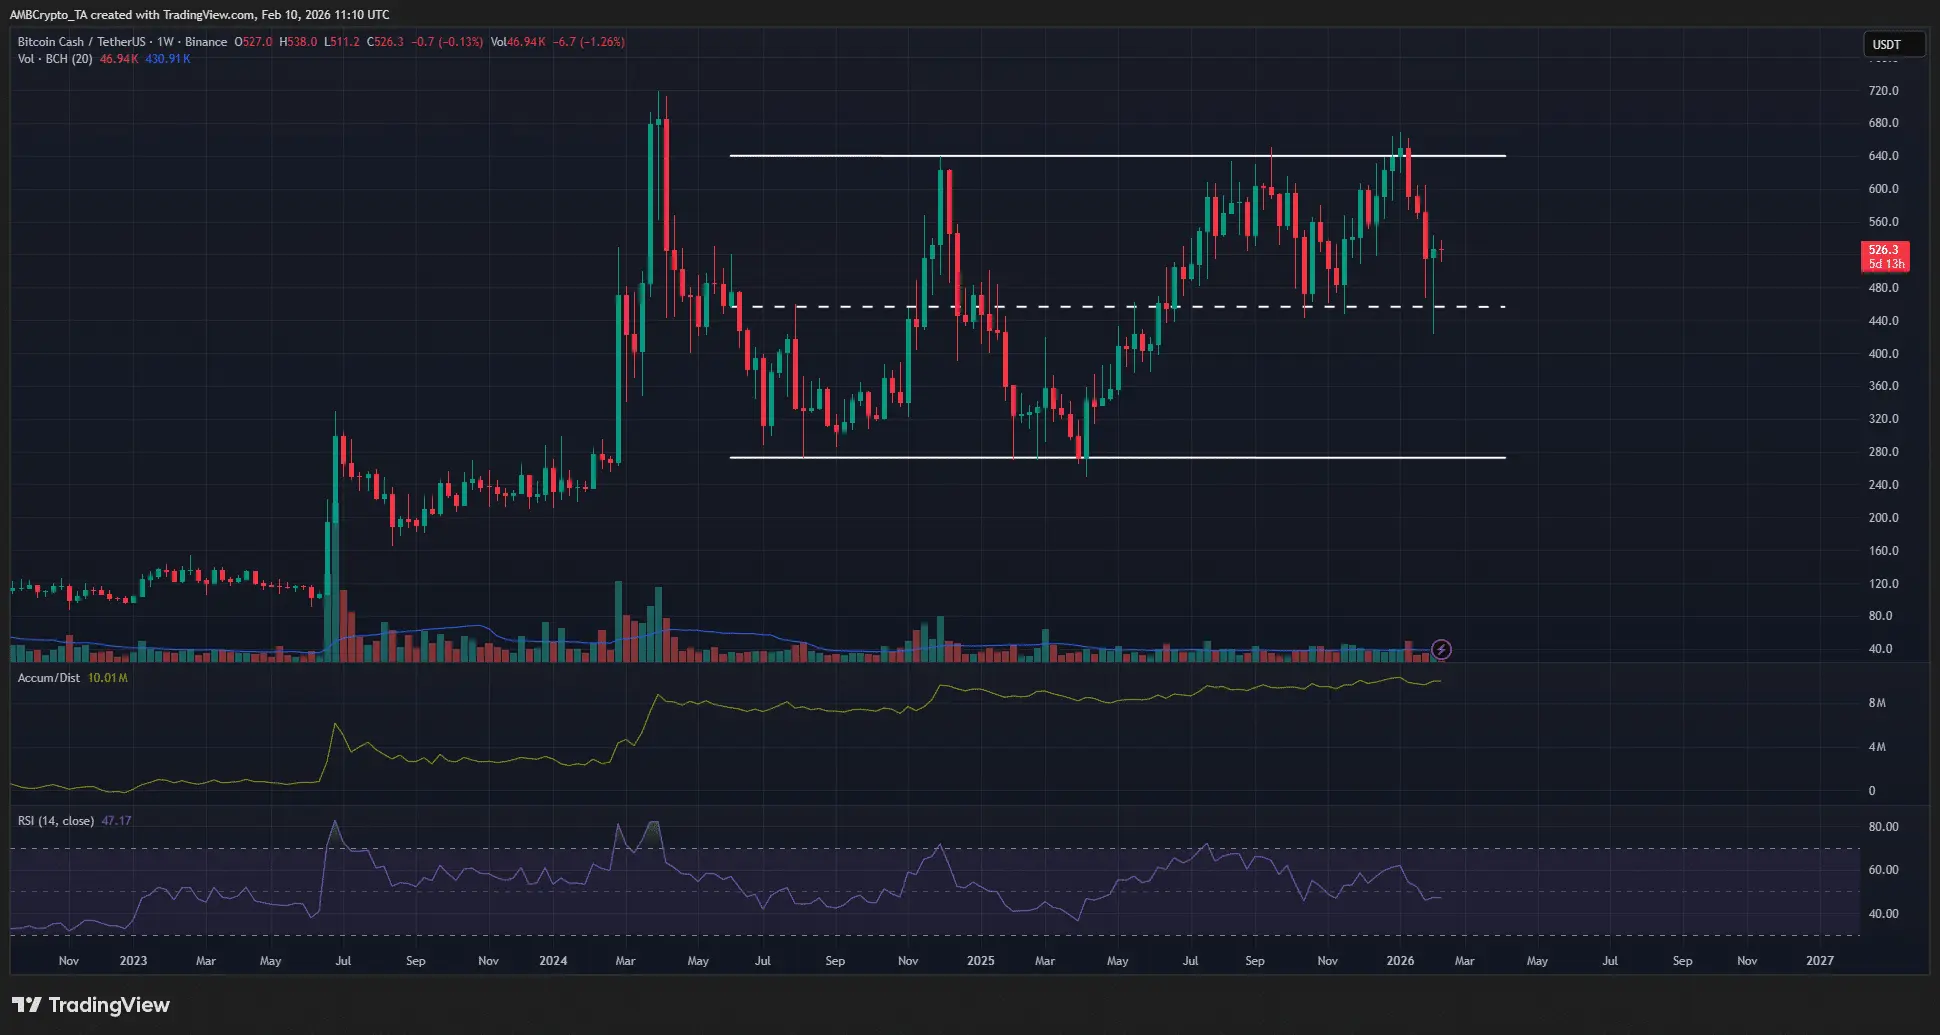 Source: TradingView The accumulation/distribution (A/D) indicator has maintained an upward trend since 2024, reflecting steady buying pressure. Additionally, the weekly RSI is currently at 47, indicating neutral momentum.
Combined with long-term price action, the $440–$460 zone is considered a low-risk, high-reward buying opportunity for investors.
Local supply zones may exert downward pressure
Liquidation heatmaps show that the $550 and $610 price levels are important nearby zones with significant potential to attract upward price movement before a reversal occurs. Notably, the supply zone at $550 has accumulated liquidity over the past 10 days.
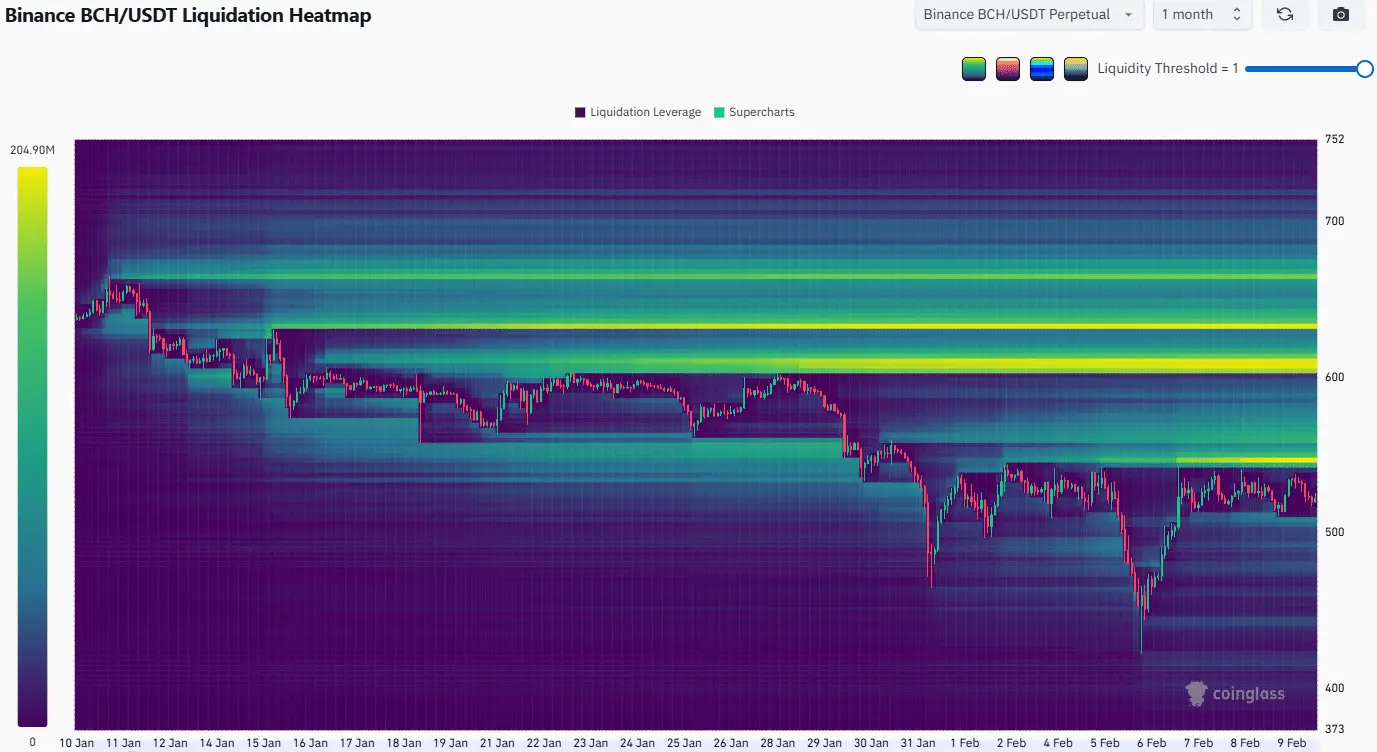 Source: CoinGlass Furthermore, the 4-hour chart indicates that BCH buyers have failed to break through the resistance at $540.
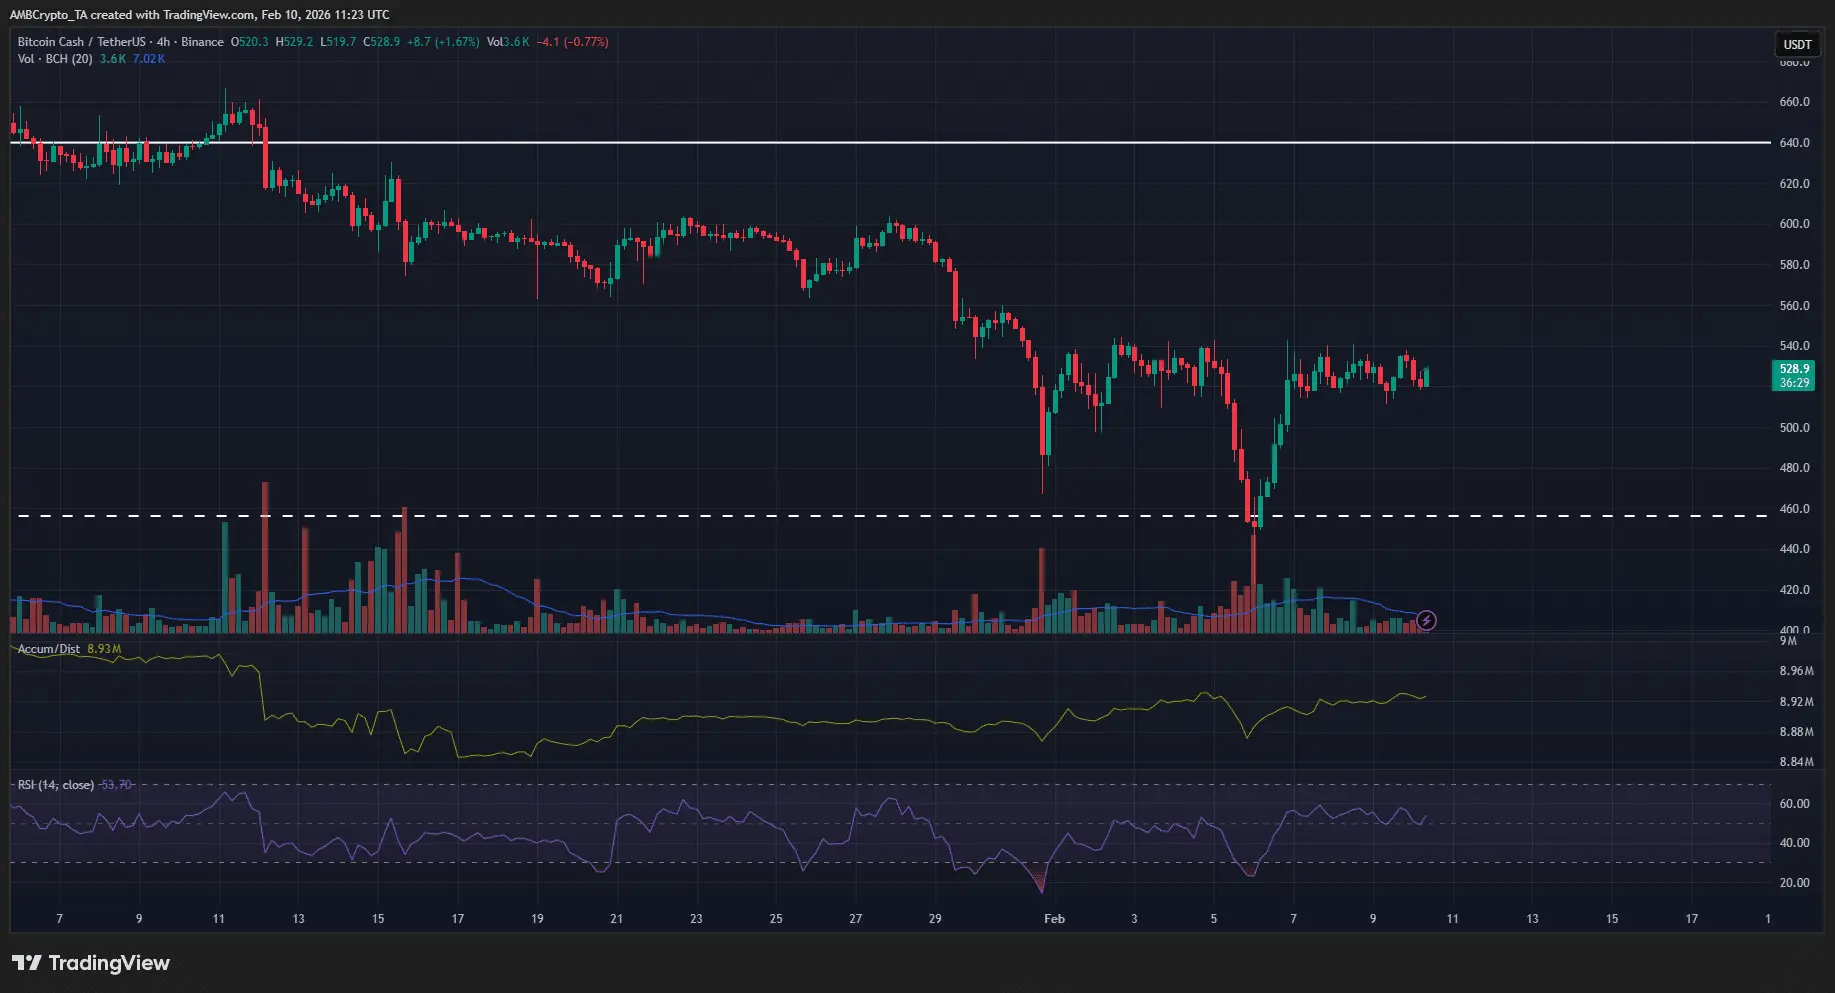 Source: TradingView Therefore, a possible scenario is that the price will be pushed higher in the short term to the $550–$560 zone before correcting downward to around $460. However, if BCH can break above $580, this scenario will be invalidated, opening the potential for a stronger rally.
Disclaimer: The information on this page may come from third parties and does not represent the views or opinions of Gate. The content displayed on this page is for reference only and does not constitute any financial, investment, or legal advice. Gate does not guarantee the accuracy or completeness of the information and shall not be liable for any losses arising from the use of this information. Virtual asset investments carry high risks and are subject to significant price volatility. You may lose all of your invested principal. Please fully understand the relevant risks and make prudent decisions based on your own financial situation and risk tolerance. For details, please refer to
Disclaimer.
Related Articles
Michael Saylor: The next phase of Bitcoin is digital credit
MicroStrategy founder Michael Saylor proposes the concept of digital credit as a development direction for the cryptocurrency market. Using STRC preferred stock as an example, he emphasizes its low volatility and high yield characteristics. In Saylor's three-layer digital capital framework, digital credit aims to provide stable returns and bridge the gap in institutional crypto allocations, although it also faces critics' concerns about its sustainability.
MarketWhisper7m ago
JPMorgan: Bitcoin absorbs Iran war hedge funds, gold ETF experiences significant outflows
JPMorgan report indicates that due to the Iran conflict, Bitcoin outperformed gold and silver, the latter of which experienced significant declines due to rising interest rates and a strong dollar. Gold's high-position holdings were forcibly liquidated under market pressure, leading to capital outflows. Bitcoin remained stable, demonstrating its appeal as a safe-haven asset, especially amid geopolitical tensions. The report also emphasizes that Bitcoin's market liquidity has surpassed gold, indicating an improvement in its structural position.
MarketWhisper37m ago
Why did Bitcoin drop today? Trump extends Iran ceasefire period by 10 days, negotiations face disagreements.
U.S. President Trump extends the ceasefire period with Iran until April 6, but Iranian officials deny the request, leading to continued market pessimism about the prospects of negotiations. As the U.S. 10-year Treasury yield rises to 4.42%, the attractiveness of high-risk assets like Bitcoin diminishes, preventing a rebound and instead continuing to face selling pressure. The market is sensitive to liquidity conditions, and in the short term, attention should be paid to the direction of yields and spot demand.
MarketWhisper42m ago
Today, the cryptocurrency Fear & Greed Index rose to 13, indicating extreme fear in the market.
Gate News reports that on March 27, data from Alternative.me shows that today’s cryptocurrency Fear and Greed Index has risen to 13, indicating the market is in a state of "extreme fear." Yesterday, the index was 10, also in the "extreme fear" zone.
GateNews1h ago
23.91% Plunge for KMD: What It Means for Traders
KMD has seen a significant decline, trading at $0.005324 after dropping 54.20% in 24 hours. Increased market activity and liquidation events in the derivatives market are contributing to the volatility, prompting traders to focus on risk management.
Coinfomania1h ago
MemeCore Price Volatility Explodes After Hardfork and Perp Listing Surge - BTC Hunts
The post MemeCore Price Volatility Explodes After Hardfork and Perp Listing Surge appeared first on Coinpedia Fintech News
MemeCore price just pulled off one of those blink-and-you-miss-it moves. A brutal 65% intraday surge sent the token flying from $1.70 to $2.80 only to slam straight into a
BTCHUNTS1h ago
