Pump.fun (PUMP) continues to face correction pressure, declining about 2% at the time of writing on Tuesday, extending the previous session’s 4% plunge. The token of this launchpad platform remains at risk of deeper decline, as 10 billion PUMP are scheduled to be unlocked today, increasing supply pressure amid waning retail investor interest. From a technical perspective, PUMP’s outlook continues to lean toward a negative scenario, with selling pressure clearly dominant and bearish momentum still prevailing in the market.
Monthly token unlocks and weak demand increase downside risk
Data from DeFiLlama indicates that approximately 10 billion PUMP tokens will be unlocked on Tuesday evening and distributed to the community fund and ecosystem. With a total value exceeding $20 million, this amount—especially the portion allocated to the community—could add to selling pressure, as investor sentiment has not yet recovered from last week’s sharp market sell-off.
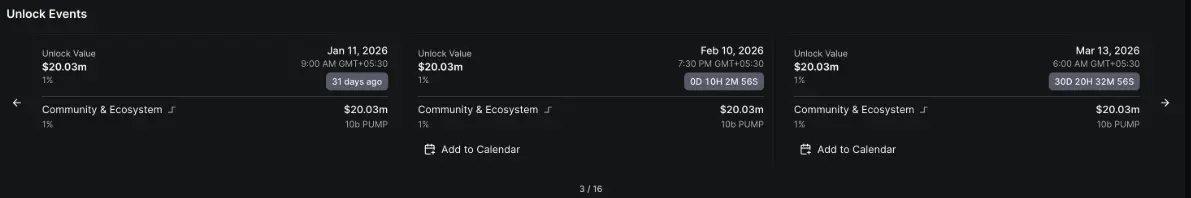 PUMP unlock data | Source: DeFiLlama Conversely, data from CoinGlass shows that the open interest (OI) of PUMP futures contracts has been steadily declining, dropping to $161.95 million on Tuesday. This trend reflects increasing caution and diminishing participation from retail investors.
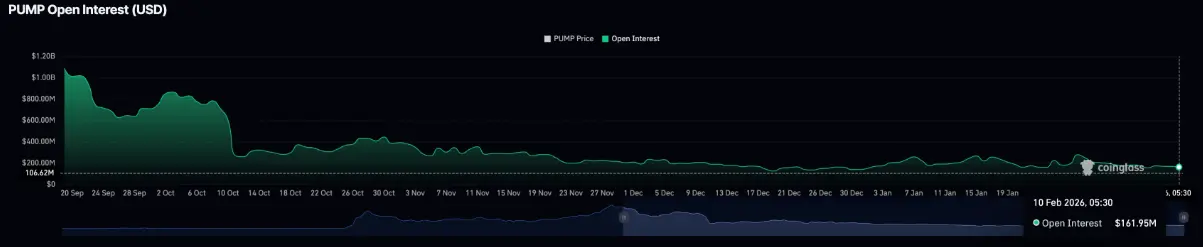 PUMP futures open interest (OI) | Source: CoinGlass
Technical analysis: Will PUMP continue to fall sharply?
PUMP broke below the key psychological level of $0.002000 after a 4% decline on Monday. The selling momentum shows no signs of stopping; as of this writing, the price continued to lose nearly 2% on Tuesday, marking the fourth consecutive day of decline since the peak on February 6 at $0.002201.
The current weakening trend is pushing PUMP close to the support zone at $0.001886—corresponding to the 4-hour candle low formed on February 5. If the price closes clearly below this level on the 4-hour chart, the downtrend is likely to extend, with the next target being the December 29 low around $0.001775.
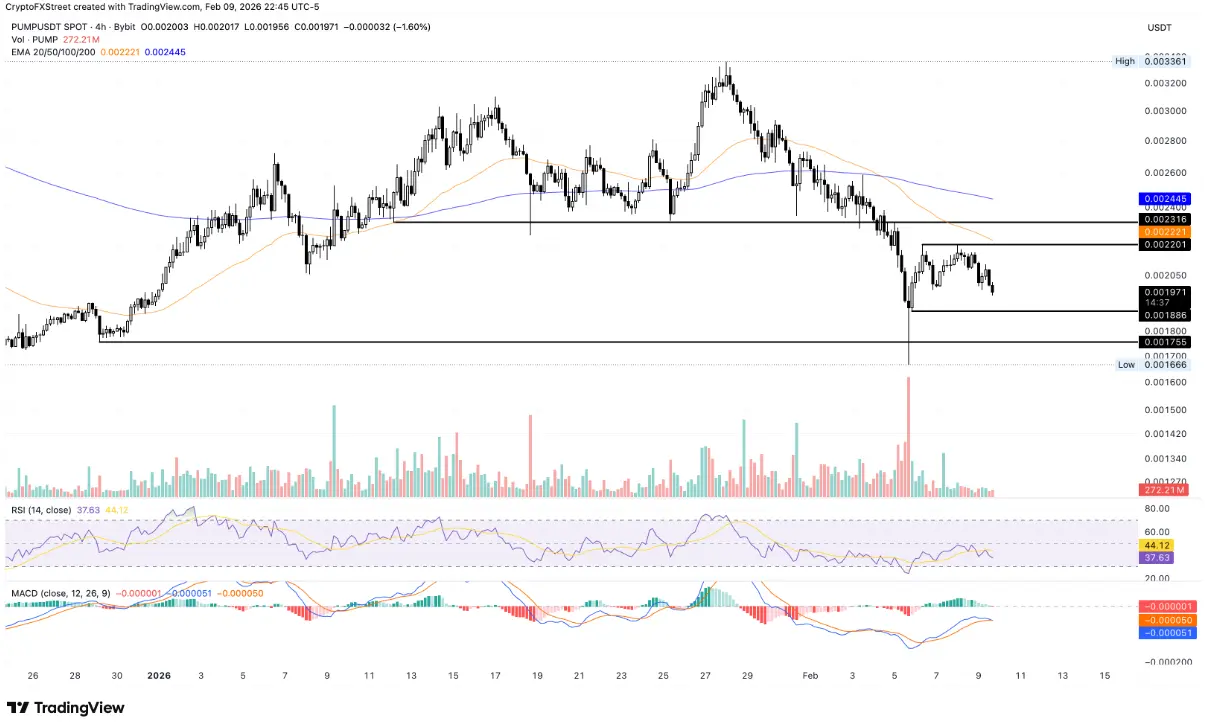 PUMP/USDT 4-hour chart | Source: TradingView
From a technical standpoint, momentum indicators on the 4-hour chart are leaning toward a negative scenario. The RSI has retreated to around 40 and turned downward from the neutral zone, indicating room for correction before entering oversold territory. Meanwhile, the MACD line is approaching the signal line, increasing the risk of a bearish crossover.
Conversely, if the bulls manage to quickly regain the $0.002000 level, the price could recover to test the 50-period EMA at $0.002213, near the short-term high on February 6 at $0.002201.
Disclaimer: The information on this page may come from third parties and does not represent the views or opinions of Gate. The content displayed on this page is for reference only and does not constitute any financial, investment, or legal advice. Gate does not guarantee the accuracy or completeness of the information and shall not be liable for any losses arising from the use of this information. Virtual asset investments carry high risks and are subject to significant price volatility. You may lose all of your invested principal. Please fully understand the relevant risks and make prudent decisions based on your own financial situation and risk tolerance. For details, please refer to
Disclaimer.
Related Articles
ETH 15-minute rise of 0.59%: ETF event expectations drive the intraday upward move
From 2026-03-31 13:45 to 14:00 (UTC), the ETH spot market recorded a +0.59% return. The price ranged from 2063.14 to 2079.88 USDT, with a volatility of 0.81%. During this period, market fluctuations slightly increased, activity became more prominent, and ETF-related events drew market attention. Traders’ sentiment focused on the upcoming capital flows associated with these events.
The main driver behind this movement was related to ETH ETF market developments. On March 31, 2026, regarding “Ethereum ETF Flo” (the original text is incomplete here, but the translation continues with the full content), the market reacted to the news and expectations surrounding the approval and launch of Ethereum ETFs, which influenced trading behavior and sentiment.
GateNews29m ago
Downside risk remains as bitcoin nears record-tying six-month losing streak
Bitcoin is nearing a record of six consecutive monthly losses, with declines in October, November, and December. While current support levels are holding, macroeconomic factors and ongoing conflicts pose risks to recovery.
CoinDesk49m ago
BTC Price Plunges to 3-Week Low as Analysts Map Out Next Downside Targets
The first breakdown to under $68,000 seemed as just the beginning for bitcoin’s Friday correction, which just worsened with another dip to a fresh 3-week low.
Most altcoins have followed suit, which has harmed over-leveraged traders, with more than 120,000 such participants being wrecked in the
CryptoPotato1h ago
Bitcoin Cash and NEAR Protocol lead CoinDesk 20 as the market trades sideways
Bitcoin Cash and NEAR Protocol emerged as leaders in the CoinDesk 20 index as the cryptocurrency market remained stagnant. While the index showed no significant movement, BCH increased by 1.5% and NEAR by 1.9%, indicating selective investor interest despite overall market caution.
TapChiBitcoin1h ago
ETH 15-minute price up 0.61%: Active buying comes in, and a breakout above a key level in tandem boosts short-term performance
2026-03-31 13:00 to 13:15 (UTC), ETH fluctuated within the 2047.63 to 2061.18 USDT range. The 15-minute candlestick return recorded +0.61%, with a range of 0.66%. During this period, market attention clearly increased; short-term long sentiment edged upward, volatility intensified, and it attracted incremental liquidity to enter.
The main drivers behind this anomaly are a slight uptick in on-chain trading volume and the emergence of aggressive buy orders. ETH’s on-chain average daily number of transactions remained at a high level of 2,000,000. In the window, spot market trading volume increased, and on-chain transfers accounted for a significant portion of the activity, reflecting increased market participation and liquidity inflows.
GateNews1h ago
Ripple Price Analysis: XRP Enters Q2 With No Bullish Reversal Signs
XRP is wrapping up Q1 2026 at around $1.30, sitting near its lowest levels in the past couple of years. The altcoin has shed the vast majority of its gains from the cycle peak and continues to bleed against both the dollar and Bitcoin. And the worst news? There is no technical sign of a reversal as
CryptoPotato1h ago
