Bitcoin Cash (BCH) fell below $522 on Tuesday, after repeatedly being resisted at $534.80. The long-short ratio of 0.90 indicates a bearish dominance, with both spot and futures markets showing selling pressure. The RSI is at 44, below the neutral level, suggesting a potential dead cat bounce followed by further decline toward the $478.70 support level.
BCH Long-Short Ratio 0.90 Reveals Bearish Dominance
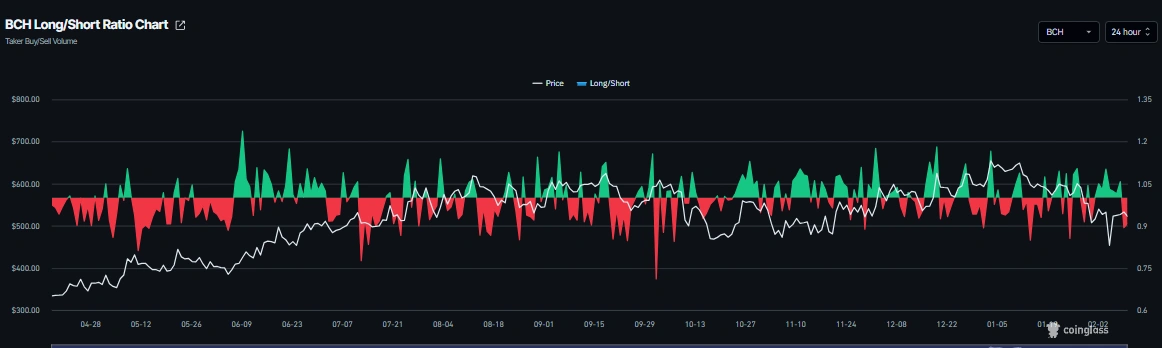
(Source: Coinglass)
Derivatives data for Bitcoin Cash clearly shows a bearish outlook. On Tuesday, CoinGlass data indicated a BCH long-short ratio of 0.90. This ratio below 1 signals bearish market sentiment, as more traders are betting on a decline in the asset’s price. The long-short ratio is calculated by dividing the number of open long contracts by open short contracts; a reading of 0.90 means that for every 100 short positions, there are only 90 long positions.
This bearish advantage is not uncommon in BCH history, but given the current technical breakdown, the bearish derivatives sentiment will likely amplify downward pressure. When the spot price declines, short positions profit, while long positions lose or get liquidated. This asymmetric risk-reward structure encourages more traders to join the short side, creating a self-reinforcing downward spiral.
CryptoQuant’s aggregated data supports a negative outlook from another perspective. The platform tracks capital flows and position structures in BCH spot and futures markets, showing selling pressure dominating both markets, indicating an imminent correction. The spot market’s selling advantage suggests actual holders are reducing their positions, rather than short-term traders speculating. The futures market’s short dominance indicates professional traders are pessimistic about BCH’s future.
Historically, when BCH’s long-short ratio falls below 1 and remains there for several days, it often accompanies further price declines. Only when the ratio recovers above 1 and technical signs stabilize can the downtrend truly reverse. Therefore, investors should closely monitor changes in the long-short ratio, as it provides important clues for trend reversals.
Three Major Bearish Implications of a 0.90 Long-Short Ratio
Bearish Position Dominance: More traders betting on decline, forming a consensus to short
Asymmetric Liquidation Risk: Price drops force longs to close positions, increasing short profits
Sentiment Contagion Effect: Pessimism in derivatives markets influences spot holders’ confidence
For traders, going long in an environment where the long-short ratio is below 1 requires extreme caution. Unless there are clear technical reversal signals or major positive news, contrarian long positions carry high risk. Conversely, short-term traders might consider trend-following shorts but should set strict stop-losses to guard against sudden rebounds.
$534 Resistance Triple Top: BCH’s Upward Momentum Exhausted
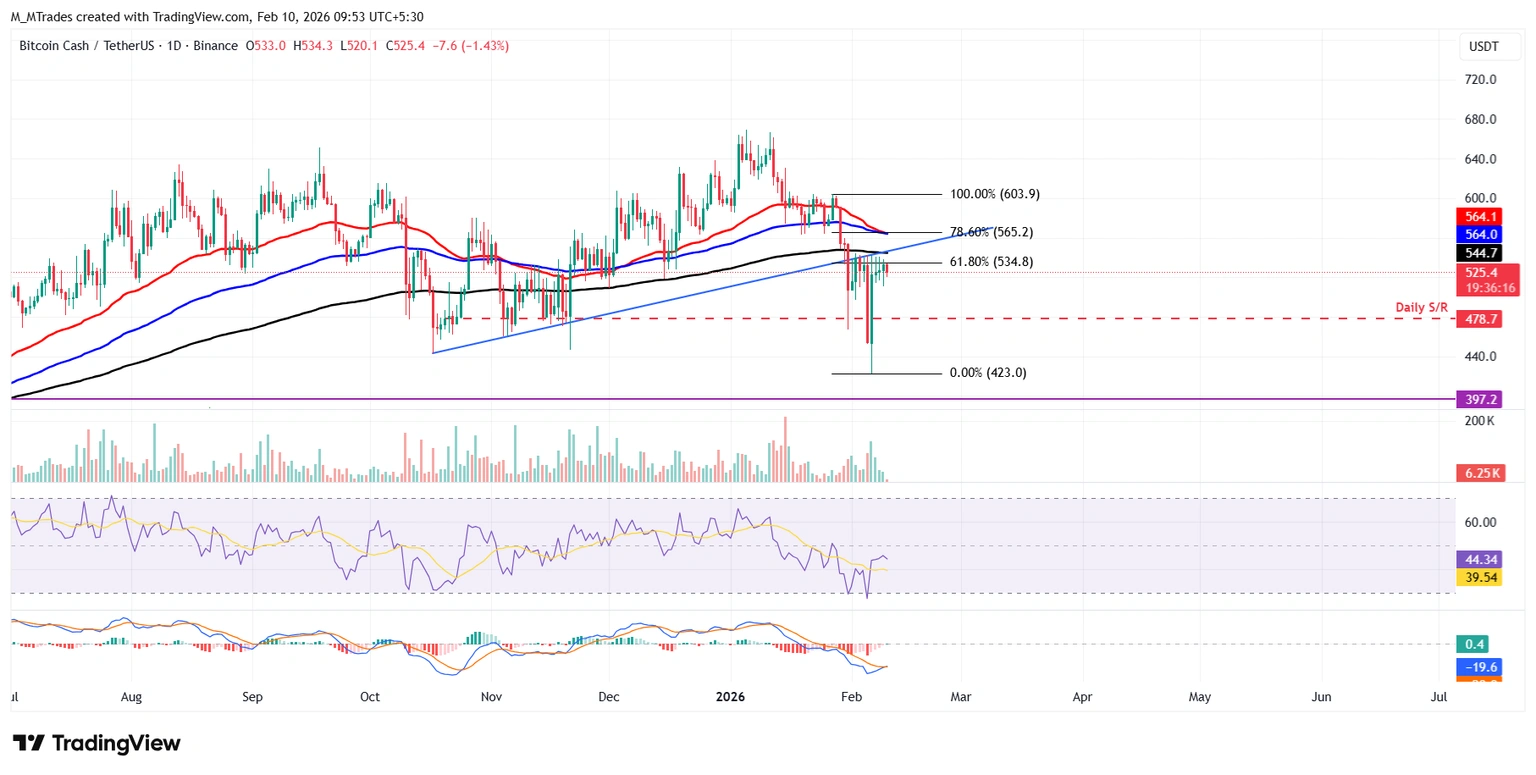
(Source: Trading View)
Bitcoin Cash repeatedly faced resistance near $534.80, which aligns with the 61.8% Fibonacci retracement level (from the high of $603.90 on January 27 to the low of $423.00 on February 6). This level roughly coincides with the broken upward trendline and the 200-day exponential moving average (EMA) at $544.70, making it a critical reversal zone.
In technical analysis, multiple rejections at the same resistance level often indicate heavy selling pressure at that price. The $534.80 zone likely has substantial limit sell orders from previous holders (waiting to break even), profit-takers (locking in gains), and tactical shorts (shorting at resistance). The confluence of these forces causes BCH to face strong resistance each time it approaches this level.
More concerning is that $534.80 overlaps with several technical indicators. The previously broken upward trendline often acts as resistance during retests, a classic technical pattern. The 200-day EMA is a key long-term trend indicator; when the price is below it, the long-term trend is considered bearish. BCH’s repeated failures in this multi-resistance zone suggest bullish momentum has exhausted, unable to push the price into a new upward phase.
Volume analysis shows BCH’s trading volume during attempts to breach $534.80 has been decreasing with each attempt. This “volume divergence” is a typical sign of weakening upward momentum. The first attempt saw the highest volume, indicating strong buying effort, but it failed to break through. The subsequent attempts had diminishing volume, implying fewer buyers willing to chase higher. This volume pattern signals an imminent reversal to the downside.
Additionally, a dead cat bounce may occur—a short-term upward correction within a broader downtrend. Dead cat bounces are common in technical analysis, representing brief rebounds after sharp declines, often failing to sustain and leading to further drops. BCH’s current price of $525.40, slightly below the $534.80 resistance, suggests it is in the potential dead cat bounce zone.
RSI and MACD Divergence: Key Technical Battle
The RSI stands at 44, below the neutral 50, and is trending downward, indicating increasing bearish momentum. RSI measures the speed and change of price movements; values below 50 suggest recent price declines dominate. Although 44 is not yet in oversold territory (below 30), it clearly shows bearish strength.
The declining RSI trend indicates that bearish momentum is not only present but also strengthening. If RSI continues downward toward oversold levels, a short-term technical rebound becomes more likely. However, at the current 44, there is still room for further downside. Only if RSI hits oversold levels and begins to rebound, especially if supported by price holding key supports, can a trend reversal be initially confirmed.
Meanwhile, MACD presents conflicting signals. The MACD line is converging, increasing the likelihood of a bullish crossover. MACD, composed of the 12-day EMA (fast line), 26-day EMA (slow line), and histogram, tracks trend momentum. A bullish crossover (golden cross) occurs when the fast line crosses above the slow line, often signaling trend reversal or continuation upward. The current convergence suggests the crossover may be imminent.
However, Nazarov emphasizes: if the MACD fails to confirm the crossover, it indicates persistent bearish momentum, increasing the risk of further decline. False crossovers are common; if the MACD line approaches the signal line but does not cross, it often signals a failed attempt at a reversal, and the price may continue downward. Traders should wait for a confirmed MACD golden cross with volume confirmation before initiating long positions.
The conflicting signals from RSI and MACD place BCH at a critical juncture. RSI shows increasing bearish momentum, supporting further downside, while MACD hints at a possible short-term rebound. This divergence often occurs at trend reversal points, and the upcoming days’ price action will determine which indicator’s signal proves more accurate.
From a practical trading perspective, when two technical indicators send conflicting signals, it’s prudent to prioritize the one aligned with volume and derivatives data. Currently, declining volume and the bearish long-short ratio of 0.90 support the bearish case, giving more weight to RSI’s downside indication. Only when MACD confirms a bullish crossover with volume expansion and the long-short ratio rises above 1 can a meaningful rebound be confirmed.
$478 Support Level and Dead Cat Bounce Trading Strategy
If BCH continues to decline, the next key support is at the daily low of $478.70, which is a previous significant low and close to the psychological level of $480. From a technical standpoint, $478.70 is critical for determining whether BCH enters a deeper bear market. A break below this level with no quick recovery could target the February 6 low of $423.
Trading dead cat bounces requires extreme caution. Aggressive traders might consider small long positions near current levels around $525, with stops below $520, targeting $534.80, risking a reward ratio of about 1:2. However, this is a contrarian bet on a rebound with relatively low probability of success. More conservative traders should wait until the price approaches $478.70 to evaluate potential bottoming or look for clear reversal signals (such as MACD bullish crossover with volume increase) before entering.
Similarly, if BCH rebounds and closes above the 200-day EMA at $544.70, it could continue upward toward the resistance at $564 (the 100-day EMA). Breaking above $544.70 would be a significant trend reversal signal, indicating BCH has regained the long-term moving average and shifted from a downtrend to an uptrend. However, given current derivatives data and technical conditions, the probability of such a breakout remains relatively low.
