
Key Takeaways
-
Hyperliquid’s HIP-3 markets recorded a new all-time high daily volume of $4.83B
-
Open interest surged to a record $1.05B, up sharply from $260M last month
-
$HYPE has outperformed the broader crypto market, rising while ETH fell 24% YTD
-
The daily chart shows a Bearish Shark harmonic pattern, allowing short-term upside
-
A move toward $38.72 remains possible if momentum holds above the 50-day MA
HYPE, the native token of **Hyperliquid **— one of the fastest-growing decentralized perpetual trading platforms — has continued to show relative strength despite a broader crypto market downturn. While major assets like Ethereum (ETH) have suffered a sharp 24% decline year-to-date, HYPE has managed to stay bullish, posting over 21% gains during the same period.
This divergence has naturally caught traders’ attention. But beyond short-term price action, a deeper look into on-chain growth metrics and technical structure suggests that HYPE’s momentum may be driven by strong underlying fundamentals rather than pure speculation.
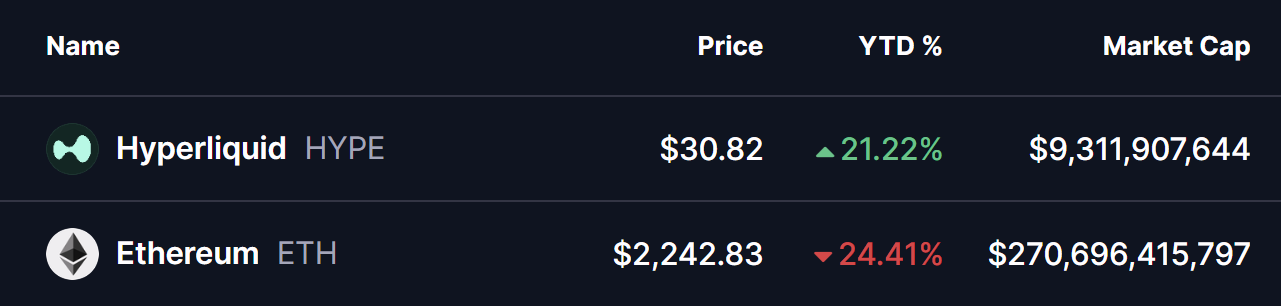
Source: Coinmarketcap
Hyperliquid’s HIP-3 Markets Hit Record Activity
According to the latest data from Flowscan, Hyperliquid’s HIP-3 protocol — launched last fall to enable permissionless on-chain markets for assets like gold, silver, and other commodities — has entered a phase of explosive growth.
Over the past week, daily trading volume across HIP-3 markets surged to approximately $4.83 billion, marking a new all-time high. At the same time, open interest (OI) climbed to a record $1.05 billion, fueled largely by rising demand for on-chain commodities exposure.
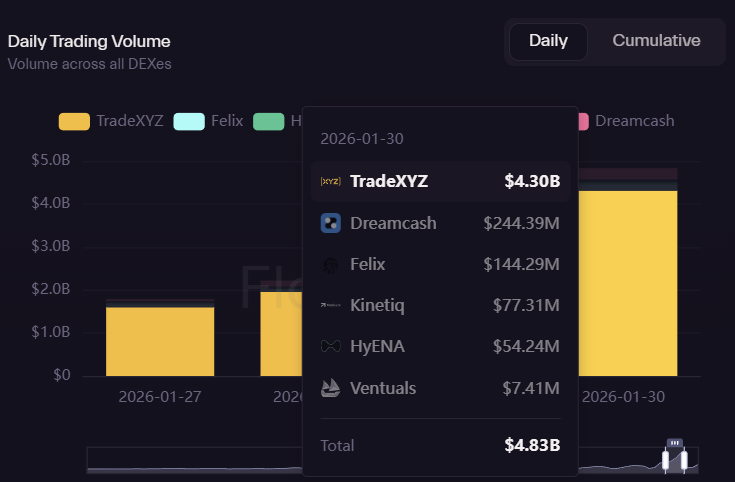
Source: Flowscan
What makes this growth particularly notable is its speed. Just a month ago, HIP-3 open interest hovered near $260 million. Since then, OI has consistently printed new weekly highs, signaling a rapid influx of capital and increasing trader participation within the Hyperliquid ecosystem.
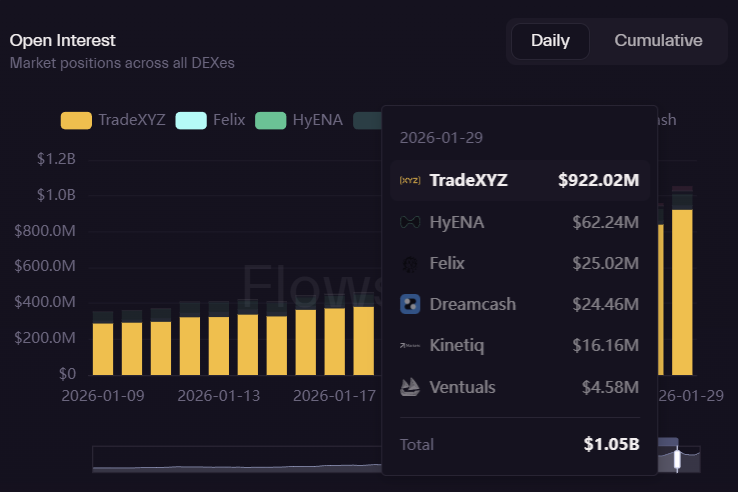
Source: Flowscan
This surge in volume and open interest reflects growing confidence in Hyperliquid’s infrastructure and execution — a dynamic that historically acts as a strong tailwind for the platform’s native token.
$HYPE Technical Structure Signals Room for Upside
From a technical standpoint, HYPE’s daily chart is forming a Bearish Shark harmonic pattern. While the name sounds ominous, this structure often appears during corrective phases and can still allow for short-term bullish continuation before a larger trend decision unfolds.
After completing the O–X–A–B leg, HYPE successfully reclaimed its 50-day moving average, a key signal that short-term momentum has shifted back in favor of buyers. Since then, price has been consolidating near the $30 region, suggesting accumulation rather than distribution.
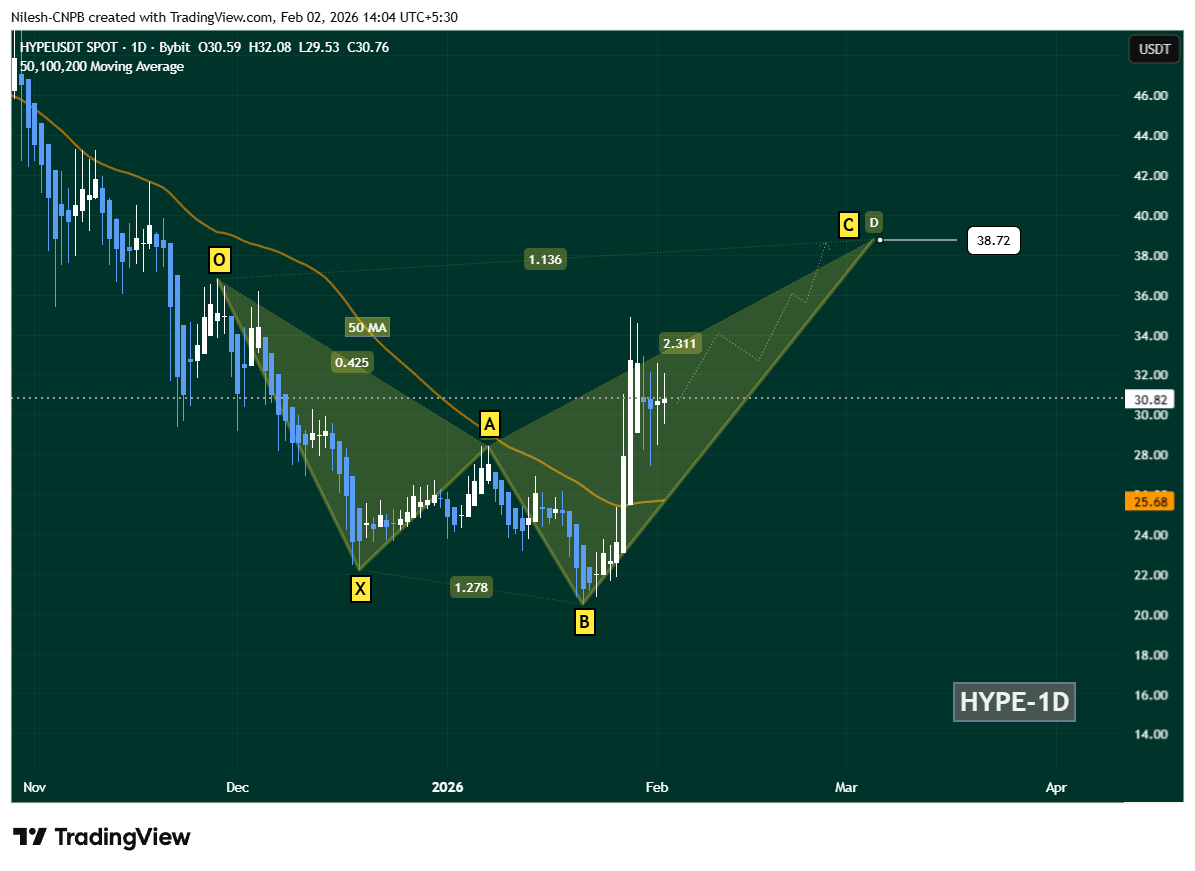
Hyperliquid (HYPE) Daily Chart/Coinsprobe (Source: Tradingview)
If current momentum holds, HYPE could continue its advance toward the C-point of the Shark pattern near $38.72. This level aligns closely with the 1.13 Fibonacci extension, a common target zone during harmonic pattern development and a logical area for the next technical reaction.
Market Outlook
With HIP-3 markets printing record volumes and open interest expanding at a rapid pace, Hyperliquid’s ecosystem growth appears firmly intact. If on-chain activity continues to scale alongside favorable technical conditions, HYPE may remain one of the stronger relative performers in the current market environment.
For now, traders will be watching whether HYPE can maintain support above the 50-day moving average and build enough momentum to challenge the $38–$40 resistance zone in the coming sessions.
Disclaimer: The views and analysis presented in this article are for informational purposes only and reflect the author’s perspective, not financial advice. Technical patterns and indicators discussed are subject to market volatility and may or may not yield the anticipated results. Investors are advised to exercise caution, conduct independent research, and make decisions aligned with their individual risk tolerance.
About Author: Nilesh Hembade is the Founder and Lead Author of Coinsprobe, with over 5 years of experience in the cryptocurrency and blockchain industry. Since launching Coinsprobe in 2023, he has been providing daily, research-driven insights through in-depth market analysis, on-chain data, and technical research.
Disclaimer: The information on this page may come from third parties and does not represent the views or opinions of Gate. The content displayed on this page is for reference only and does not constitute any financial, investment, or legal advice. Gate does not guarantee the accuracy or completeness of the information and shall not be liable for any losses arising from the use of this information. Virtual asset investments carry high risks and are subject to significant price volatility. You may lose all of your invested principal. Please fully understand the relevant risks and make prudent decisions based on your own financial situation and risk tolerance. For details, please refer to
Disclaimer.
Related Articles
VRA Soars Past $0.000044 — 24.57% Surge Catches Traders Off Guard
VRA's price surged 24.57% in five minutes to $0.000044, driven by whale activity and increased market sentiment. With a trading volume of over $33.7 billion, traders are monitoring key resistance and support levels for future movements.
Coinfomania10m ago
Solana challenges Ethereum: Can the SOL/ETH pair reclaim the 0.05 mark in Q2?
The long-term growth of a blockchain network is always tied to the size of the developer ecosystem. As more and more developers join in building, the pace of infrastructure upgrades accelerates, which in turn attracts more users to layer 1 (L1), increases on-chain activity, and boosts the network’s overall value.
TapChiBitcoin12m ago
Bitcoin may record its second consecutive six-month decline in history, following its first consecutive six-month drop, after which it surged by 208%.
BlockBeats news, on March 29, according to Coinglass data, Bitcoin's return rate for March this year is currently reported at -0.76%, which may mark the sixth consecutive month of decline.
Historically, Bitcoin has only experienced a similar situation once: from August 2018 to January 2019, it fell approximately 54.8% over six months. Subsequently, Bitcoin saw a continuous rise for five months (from February 2019 to June 2019), with a total increase of up to 208%.
BlockBeatNews44m ago
Altcoin XRP Makes Bullish Breakout Against Bitcoin, Projecting a Possible Massive Surge Ahead
Altcoin XRP makes bullish breakout against Bitcoin (BTC).
The asset is projected towards hitting bullish new ATH prices.
The price of XRP could surge over 600% to hit ATH targets over $10.
The crypto market prepares to see Bitcoin (BTC) make its sixth consecutive red close, a pattern
CryptoNewsLand58m ago
Over $14 billion in Bitcoin options will expire on Friday, with the market closely watching the $75,000 "magnetic price level."
This Friday, Deribit will settle approximately $14.16 billion in Bitcoin options, with the market expecting $75,000 as a key "magnet price." The current price of Bitcoin is around $71,617, still some distance from the most painful point of $75,000, and significant volatility may occur in the next two days. Although market sentiment is focused on a rebound, the demand for hedging remains high, reflecting short-term fluctuation risks.
区块客1h ago
Pi Network’s PI Token Rebounds, Bitcoin (BTC) Maintains $66K: Weekend Watch
Bitcoin's price has stabilized above $66,000 despite recent volatility influenced by geopolitical events. Altcoins, including ETH and XRP, have seen minimal movement, while some smaller coins like SIREN and PI experience notable gains. The overall crypto market cap remains steady.
CryptoPotato1h ago
