At a glance, the weekly chart shared by Erick Crypto tells a pretty straightforward story. The LTC price is still hanging out in the same support zone it’s been defending for years.
With Litecoin trading around $59, the price is right in that $55–$60 area that keeps showing up as a line buyers are willing to protect. This isn’t some new level that just formed last week. It’s a zone that’s been tested through multiple market phases, which is why it’s starting to matter again.
- Years of Sideways Action in LTC Are Starting to Add Up
- Why This Support Zone Keeps Getting Defended
- What a Move Higher Could Look Like for Litecoin
Years of Sideways Action in LTC Are Starting to Add Up
On the chart shared by Erick, it becomes clear how long Litecoin has been stuck in this range. After topping out in 2021 and unwinding through 2022, the LTC price has spent most of the last couple of years chopping sideways. Rallies fade, dips get bought, and price keeps circling back to the same area.
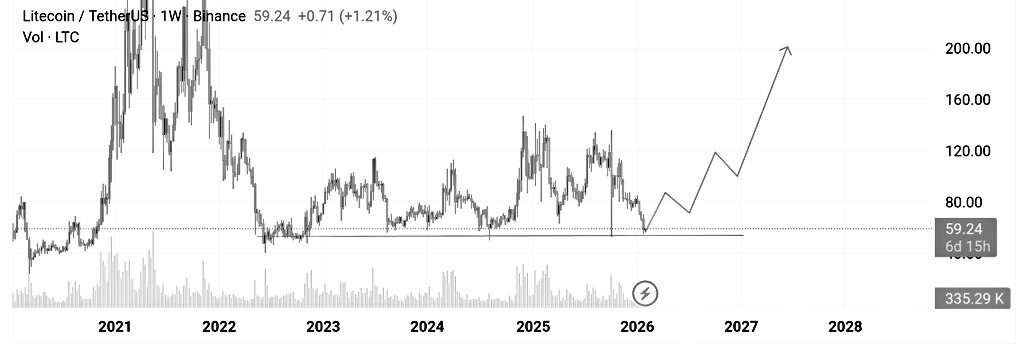
Source: X/@ErickCrypto21M
That kind of action can feel frustrating, but it usually isn’t random. Sellers have had plenty of chances to push Litecoin lower, and they haven’t been able to do it in a lasting way.
At the same time, buyers haven’t been strong enough to force a breakout either. What you end up with is a long base that quietly gets stronger the longer it holds support.
Why This Support Zone Keeps Getting Defended
The $55–$60 range has basically become the market’s decision point. Every time the LTC price slips into that area, selling pressure starts to ease and buyers step in. Just as important, price hasn’t been able to collapse below it and stay there.
Above this zone, there’s still plenty of overhead supply. That’s why every bounce so far has stalled and rolled over. But that repeated back-and-forth is often how accumulation plays out before a bigger move.
Litecoin (LTC) Price Cracks a 9-Year Floor – Here’s Why This Breakdown Matters_**
What a Move Higher Could Look Like for Litecoin
If this base keeps holding, the next phase probably doesn’t start with fireworks. It starts with Litecoin finally pushing above familiar resistance levels and holding them. If that happens, the chart opens up toward the $100–$120 range as a reasonable mid-term area to watch.
On a much higher timeframe, the old cycle highs near $180–$200 come back into view if the market enters a broader expansion phase. Those levels aren’t immediate targets, but they exist on the chart for a reason.
For now, the LTC price isn’t breaking down or breaking out. It’s doing the boring but important work of holding support. As long as that floor stays intact, the structure remains constructive. The real question is whether Litecoin can finally turn this long period of waiting into the start of something bigger.
Disclaimer: The information on this page may come from third parties and does not represent the views or opinions of Gate. The content displayed on this page is for reference only and does not constitute any financial, investment, or legal advice. Gate does not guarantee the accuracy or completeness of the information and shall not be liable for any losses arising from the use of this information. Virtual asset investments carry high risks and are subject to significant price volatility. You may lose all of your invested principal. Please fully understand the relevant risks and make prudent decisions based on your own financial situation and risk tolerance. For details, please refer to
Disclaimer.
Related Articles
The RWA Yield Infrastructure Trade
The essay highlights challenges in direct RWA token exposure, emphasizes the potential in leverage opportunities amid settlement delays, critiques Morpho's governance token structure, and presents Fluid as a more effective token model with stablecoin links.
CoinDesk19m ago
ETH drops 0.74% in 15 minutes: spot net outflows and fear sentiment converge to trigger selling pressure
2026-04-05 06:00 to 06:15 (UTC), ETH price oscillated in the range of 2031.63 to 2049.03 USDT, with the return rate recording -0.74% and the 15-minute amplitude at 0.85%. During this period, market attention increased, volatility intensified, and short-term capital became active.
The main driver behind this unusual move was large-scale net outflows of spot funds, with 24-hour cumulative net outflows totaling $126 million. On-chain, the number of active addresses rose to a daily high of 1.2 million, and transaction volume exceeded 1.5 million, reflecting that large holders or institutional entities accelerated asset transfers or selling during this period. The market sells
GateNews24m ago
Grayscale says 5 altcoins are at the "buy" price levels
Grayscale Investments emphasizes the potential of Sui (SUI), highlighting its programming model as suitable for organizational deployment. They see current altcoin prices, including SUI, as attractive for accumulation, signaling possible recovery as institutional demand rises.
TapChiBitcoin3h ago
ADA Price Weakens Under Resistance While Large Wallets Accumulate
Key Insights:
Cardano trades below all major moving averages, reinforcing bearish pressure while price struggles to reclaim even short-term resistance levels across multiple timeframes.
Whale wallets holding large ADA balances have steadily accumulated since February, reaching their
CryptoNewsLand11h ago
Dogecoin Holds Near $0.09 as April Pattern Shapes Outlook
Key Insights
Dogecoin maintains stability above the $0.09 support, with buyers defending the level despite consistent selling pressure that limits strong upward momentum in early April trading sessions.
April performance remains historically mixed, with past rallies and declines shaping
CryptoNewsLand11h ago
SHIB Holds Weak Range as Burn Rate Drops and Pressure Builds
Key Insights
SHIB remains within a long-standing descending channel, with price stuck in the lower range and unable to break persistent resistance levels.
The burn rate dropped sharply, removing a short-term support factor and reducing retail-driven momentum seen earlier during increased
CryptoNewsLand11h ago
