
Key Takeaways
-
Gold has surged to fresh all-time highs above $5,000, gaining over 82% in the past year.
-
Ethereum (ETH) has significantly underperformed, remaining down more than 10% over the same period.
-
A historical fractal suggests ETH may be lagging gold, similar to past cycles before major upside moves.
-
ETH appears to be consolidating below a key inverse head-and-shoulders neckline.
-
A breakout above $5,570 could trigger a strong bullish continuation toward higher targets.
-
The $2,600 support zone remains critical for maintaining the bullish fractal outlook.
Gold prices have officially surged to fresh all-time highs, breaking above the $5,000 mark and printing a peak near $5,035 on January 24, 2026. This historic rally caps off an exceptional year for the yellow metal, which is now up more than 82% over the past 12 months, firmly reclaiming its status as a global safe-haven asset.
In contrast, the broader crypto market — and Ethereum (ETH) in particular — continues to lag. Despite several recovery attempts, ETH remains down over 10% year-on-year, significantly underperforming gold. This divergence has sparked a growing debate among investors: is Ethereum simply late to the party, or is its next major move still loading?
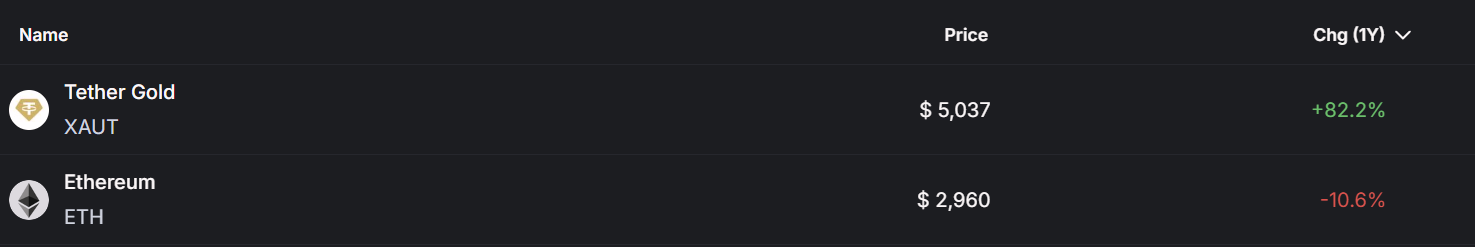
Source: Coinrank
While gold’s explosive rally dominates headlines, a quieter but potentially more important development is taking shape on Ethereum’s long-term chart. ETH’s current price structure is beginning to resemble gold’s historical setup before its own breakout — a pattern that has caught the attention of many technical analysts.
Historical Gold Fractal Hints at Bullish Potential
A chart comparison shared by analyst Crypto Rod highlights a striking fractal between gold’s past price behavior and Ethereum’s current structure.
In gold’s case, price spent years consolidating below a key resistance zone, repeatedly failing to break higher. Each pullback was shallow, and higher lows continued to form beneath resistance — a classic sign of long-term accumulation. Once gold finally cleared that ceiling by broking out from an an inverse head-and-shoulders formation, price accelerated aggressively, leading to the powerful rally we are witnessing today.
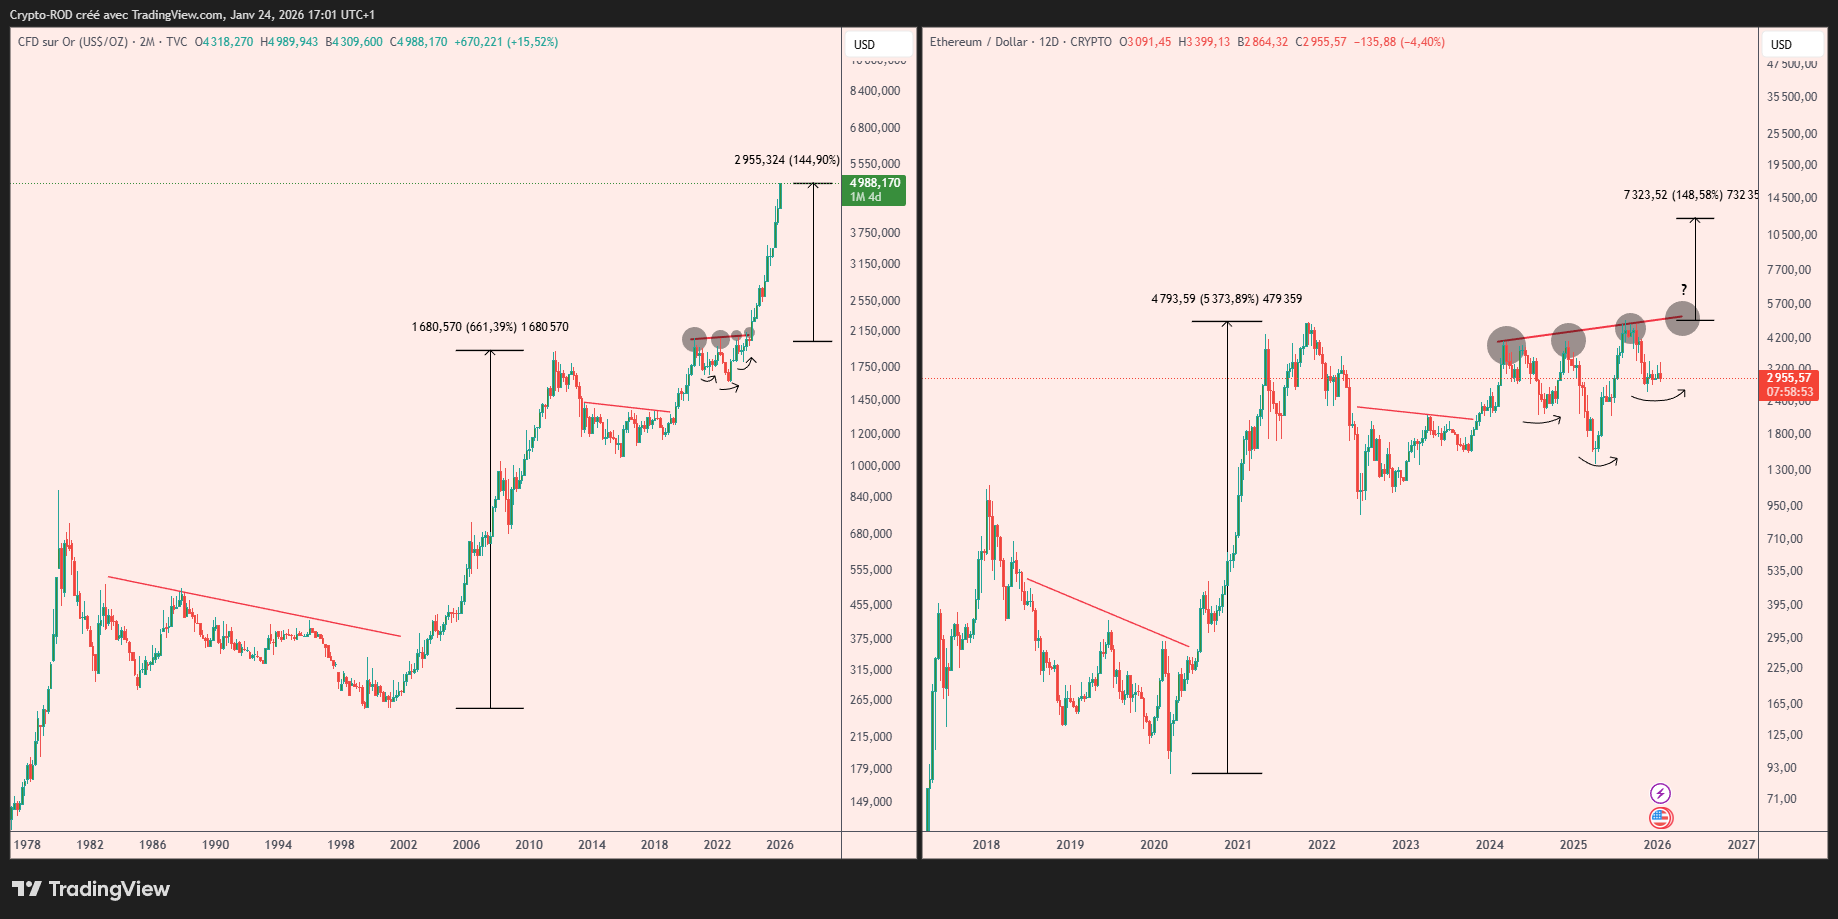
GOLD and BTC Fractal Chart/Credits: @Crypto_R0D (X)
Ethereum now appears to be in a similar phase. After its sharp rally in 2021, ETH entered a prolonged consolidation period, marked by volatile swings but steady structural support. Recent price action shows ETH carving out what looks like an inverse head-and-shoulders formation, with repeated defenses of the lower range and tightening price action beneath resistance.
Historically, Ethereum has rarely moved in perfect sync with gold. Instead, ETH has often followed gold’s directional trend with a delay, reacting only after gold establishes a clear breakout. If this historical relationship continues to play out, Ethereum’s current underperformance may not be weakness — but rather lag.
What’s Next for Ethereum (ETH)?
If this gold-to-Ethereum fractal continues to unfold, ETH’s ongoing sideways movement could represent the final stage of accumulation before a renewed bullish leg. From a technical perspective, the most important level to watch is the inverse head-and-shoulders neckline near $5,570.
A decisive breakout above this zone would mark a major shift in market structure and sentiment, potentially opening the door for a strong trend continuation. In that scenario, long-term upside targets above $10,000 would once again come back into focus.
However, patience remains key. Fractals are not guarantees — they offer historical context, not certainty. For the bullish setup to remain intact, Ethereum must continue to defend the $2,600 support zone. A sustained breakdown below this level would weaken the fractal comparison and suggest ETH needs more time to build a base before any meaningful upside can emerge.
For now, gold’s record-breaking rally serves as a powerful reminder: long consolidations often resolve sharply once conditions align. If Ethereum continues to echo gold’s historical path, the current period of calm could be setting the stage for its next major move.
Disclaimer: The views and analysis presented in this article are for informational purposes only and reflect the author’s perspective, not financial advice. Technical patterns and indicators discussed are subject to market volatility and may or may not yield the anticipated results. Investors are advised to exercise caution, conduct independent research, and make decisions aligned with their individual risk tolerance.
About Author: Nilesh Hembade is the Founder and Lead Author of Coinsprobe, with over 5 years of experience in the cryptocurrency and blockchain industry. Since launching Coinsprobe in 2023, he has been providing daily, research-driven insights through in-depth market analysis, on-chain data, and technical research.
Disclaimer: The information on this page may come from third parties and does not represent the views or opinions of Gate. The content displayed on this page is for reference only and does not constitute any financial, investment, or legal advice. Gate does not guarantee the accuracy or completeness of the information and shall not be liable for any losses arising from the use of this information. Virtual asset investments carry high risks and are subject to significant price volatility. You may lose all of your invested principal. Please fully understand the relevant risks and make prudent decisions based on your own financial situation and risk tolerance. For details, please refer to
Disclaimer.
