
Key Takeaways
-
Bitcoin is consolidating within a horizontal range after correcting from recent highs
-
Current price structure closely mirrors a bullish fractal from late 2023
-
RSI behavior suggests momentum may be rebuilding beneath the surface
-
A breakout above the $98K level could confirm bullish continuation
The broader cryptocurrency market is trading in the green, with Bitcoin (BTC) posting gains of above 2% ahead of today’s highly anticipated FOMC decision scheduled for 2:00 PM ET. Market participants widely expect the Federal Reserve to hold the federal funds rate steady within the 3.5%–3.75% range, continuing its pause following rate cuts implemented in 2025.
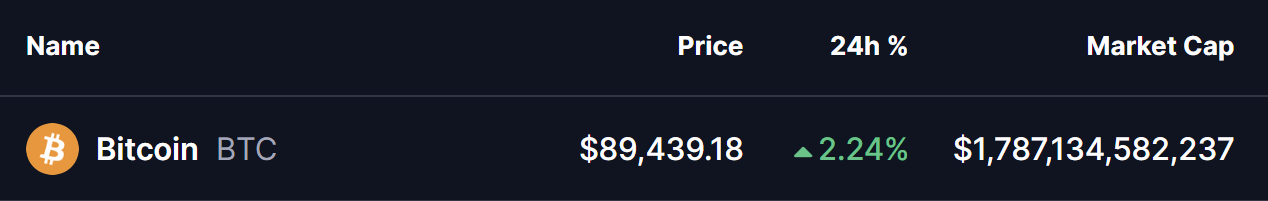
Source: Coinmarketcap
Beyond short-term macro catalysts, Bitcoin’s price structure on the daily chart is drawing increasing attention. Current price behavior closely resembles a familiar setup from 2023-2024 — a period that ultimately preceded a powerful bullish continuation. This similarity has raised the possibility that the ongoing consolidation phase may be laying the groundwork for a trend reversal rather than signaling further downside.
$BTC Mirrors a Previous Bullish Fractal
A fractal comparison shared by crypto analyst Javon Marks highlights a striking resemblance between Bitcoin’s current market structure and its price action during 2023-2024.
During that earlier phase, BTC rallied aggressively, faced a temporary rejection near resistance, and then entered a well-defined consolidation zone. That period of sideways movement formed a symmetrical structure, allowing momentum indicators like RSI to reset. Once the consolidation resolved, Bitcoin broke out decisively, triggering another leg higher toward fresh all-time highs.
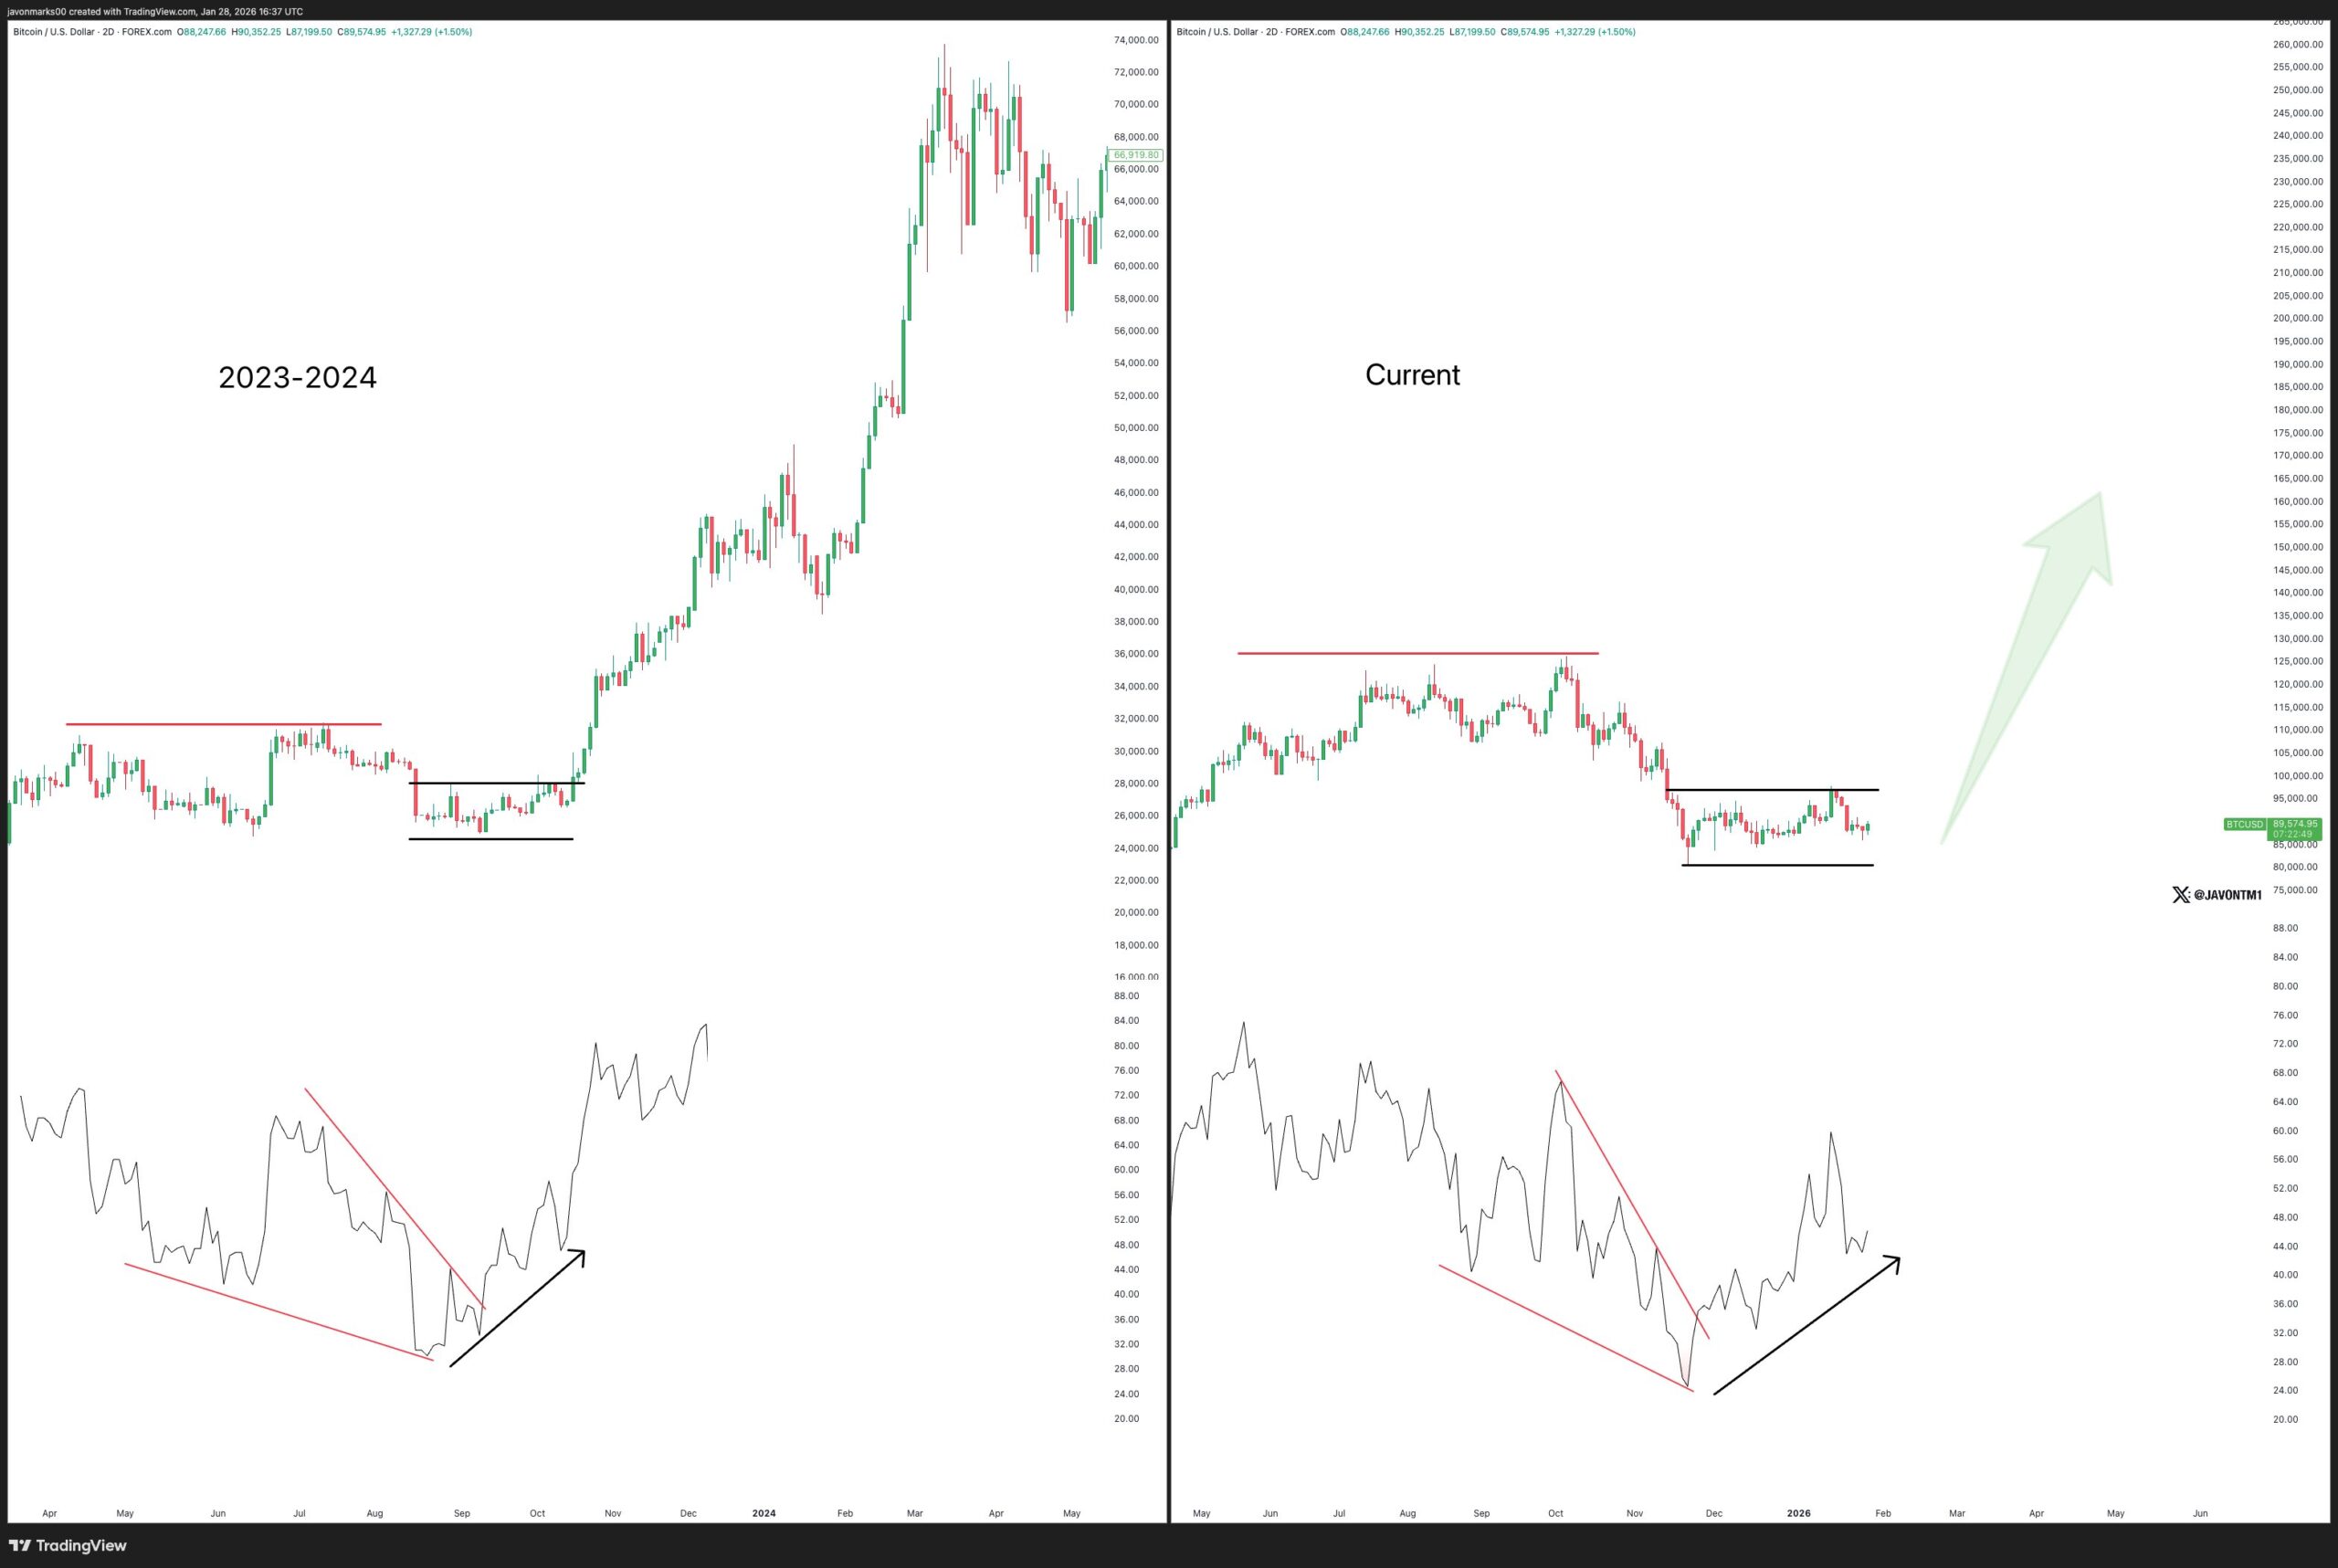
BTC Fractal Setup/Credits: @JavonTM1 (X)
Fast forward to today, Bitcoin appears to be following a similar script. After correcting from its recent all-time high near $126,000 down to the $80,000 region, BTC has stabilized and begun trading within a horizontal consolidation range between $80K-$98K.
Price action is now marked by higher lows and controlled pullbacks, mirroring the structure seen prior to the 2023 breakout. Importantly, RSI behavior is also aligning with that historical fractal, suggesting momentum may be rebuilding beneath the surface.
What’s Next for BTC?
The convergence of a horizontal consolidation pattern and RSI symmetry points to a potentially constructive phase for Bitcoin. Historically, such setups have acted as continuation bases rather than distribution zones, especially when they form after strong impulsive moves.
If BTC can achieve a decisive breakout above the upper boundary of the range, particularly with a sustained move above the $98,000 resistance level, it would lend strong confirmation to the bullish fractal thesis. Such a breakout could open the door for renewed upside momentum and a potential push toward new all-time highs.
That said, short-term volatility remains likely, especially around macro-driven events like the FOMC decision. Periods of consolidation within the current range should not be ruled out. However, as long as price continues to hold above key support and on-chain data suggests ongoing accumulation by larger players, the broader trend bias remains tilted to the upside.
Disclaimer: The views and analysis presented in this article are for informational purposes only and reflect the author’s perspective, not financial advice. Technical patterns and indicators discussed are subject to market volatility and may or may not yield the anticipated results. Investors are advised to exercise caution, conduct independent research, and make decisions aligned with their individual risk tolerance.
About Author: Nilesh Hembade is the Founder and Lead Author of Coinsprobe, with over 5 years of experience in the cryptocurrency and blockchain industry. Since launching Coinsprobe in 2023, he has been providing daily, research-driven insights through in-depth market analysis, on-chain data, and technical research.
Disclaimer: The information on this page may come from third parties and does not represent the views or opinions of Gate. The content displayed on this page is for reference only and does not constitute any financial, investment, or legal advice. Gate does not guarantee the accuracy or completeness of the information and shall not be liable for any losses arising from the use of this information. Virtual asset investments carry high risks and are subject to significant price volatility. You may lose all of your invested principal. Please fully understand the relevant risks and make prudent decisions based on your own financial situation and risk tolerance. For details, please refer to
Disclaimer.
Related Articles
The New York Times reignites the “Satoshi identity mystery”—Adam Back quickly clears things up after being targeted
Author: Nancy, PANews
Satoshi Nakamoto’s real identity remains the mystery that has persisted for 17 years in the crypto world. Speculation about this pseudonym has never stopped—candidates have ranged from cryptographers to corporate founders—but there has always been a lack of evidence to definitively settle the matter.
Recently, The New York Times published a multi-thousand-word investigation that, based on multiple comparisons drawn from linguistic style, technical pathways, and historical context, listed Blockstream CEO Adam Back as the strongest candidate for Satoshi Nakamoto. However, the claim was quickly and clearly denied by Back himself, and the relevant arguments were widely questioned by the industry as difficult to substantiate.
Satoshi Nakamoto identity controversy flares up again, with the investigation targeting Adam Back
In this investigation, The New York Times reporter John Carreyrou spent more than a year and a half deeply sorting through archives spanning decades, as well as the cryptographic punk email list, to
区块客53m ago
BTC 15-minute drop of 0.45%: Aggressive sell-side orders lead, layered with weakening liquidity at the margin, amplifying volatility
2026-04-11 23:00 to 2026-04-11 23:15(UTC), BTC’s return over 15 minutes was -0.45%, and the price fluctuated within the range of 72907.4 to 73370.7 USDT, with a swing amplitude of 0.63%. During this period, market activity remains at a high level, but the price anomaly has drawn investors’ short-term attention. Overall trading sentiment is slightly cautious, and volatility is marginally higher than usual.
The main driver behind this anomaly is that active sell orders have a slight advantage, causing a short-term downward adjustment in price. Combined with a modest increase in trading volume for major trading pairs and spot
GateNews58m ago
Bitcoin and Ether ETFs See $443 Million Inflows as Crypto Demand Picks Up
U.S. spot Bitcoin and Ether ETFs saw significant inflows, totaling $443.3 million on April 9, indicating renewed institutional interest in crypto funds. Bitcoin ETFs led with $358.1 million, driven by BlackRock's iShares, while Ether ETFs gained $85.2 million, primarily from BlackRock’s ETHA. This surge reflects a shift in investor sentiment and confidence in the crypto market.
CryptometerIo3h ago
