
Key Takeaways
-
Pump.fun (PUMP) has surged over 18% recently, extending its monthly gains to nearly 60%.
-
The daily chart shows a clear inverse head and shoulders pattern, a classic bullish reversal setup.
-
PUMP has reclaimed the 50-day moving average, which is now acting as key short-term support.
-
The $0.003025 neckline resistance is the critical breakout level to watch.
-
A confirmed breakout could target $0.004612, implying a potential 53% upside.
Pump.fun (PUMP), the native token of the popular Solana-based launchpad protocol, is quietly gaining traction in the crypto market. After posting a sharp 18%+ rally, PUMP has now extended its monthly gains to nearly 60%. While the price surge has caught traders’ attention, a closer look at the daily chart structure suggests this move could be part of a larger bullish setup — provided a key resistance level is cleared.
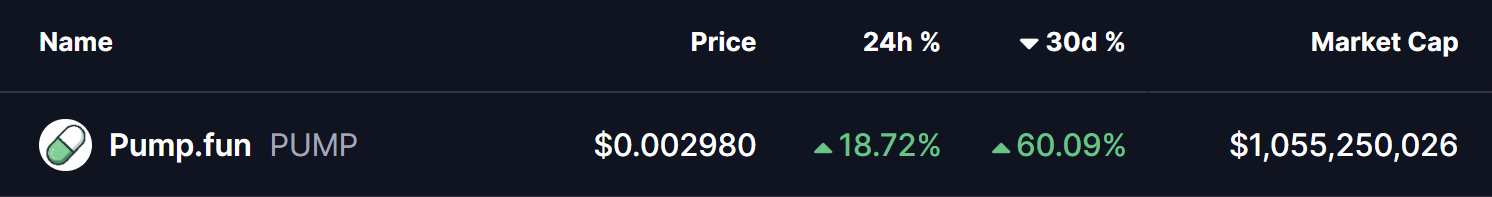
Source: Coinmarketcap
Inverse Head and Shoulders Pattern Takes Shape
On the daily timeframe, PUMP has carved out a well-defined inverse head and shoulders pattern, one of the most widely followed bullish reversal formations in technical analysis.
-
The left shoulder formed in early December near the $0.00247 region.
-
This was followed by a deeper pullback toward $0.00167, creating the head of the structure.
-
Price then recovered and found support again near $0.00225, completing the right shoulder.
Following the formation of this structure, PUMP rebounded steadily and has successfully reclaimed the 50-day moving average, which is now acting as dynamic support. The token is currently consolidating just below the neckline resistance around $0.003025, a level clearly highlighted on the chart.
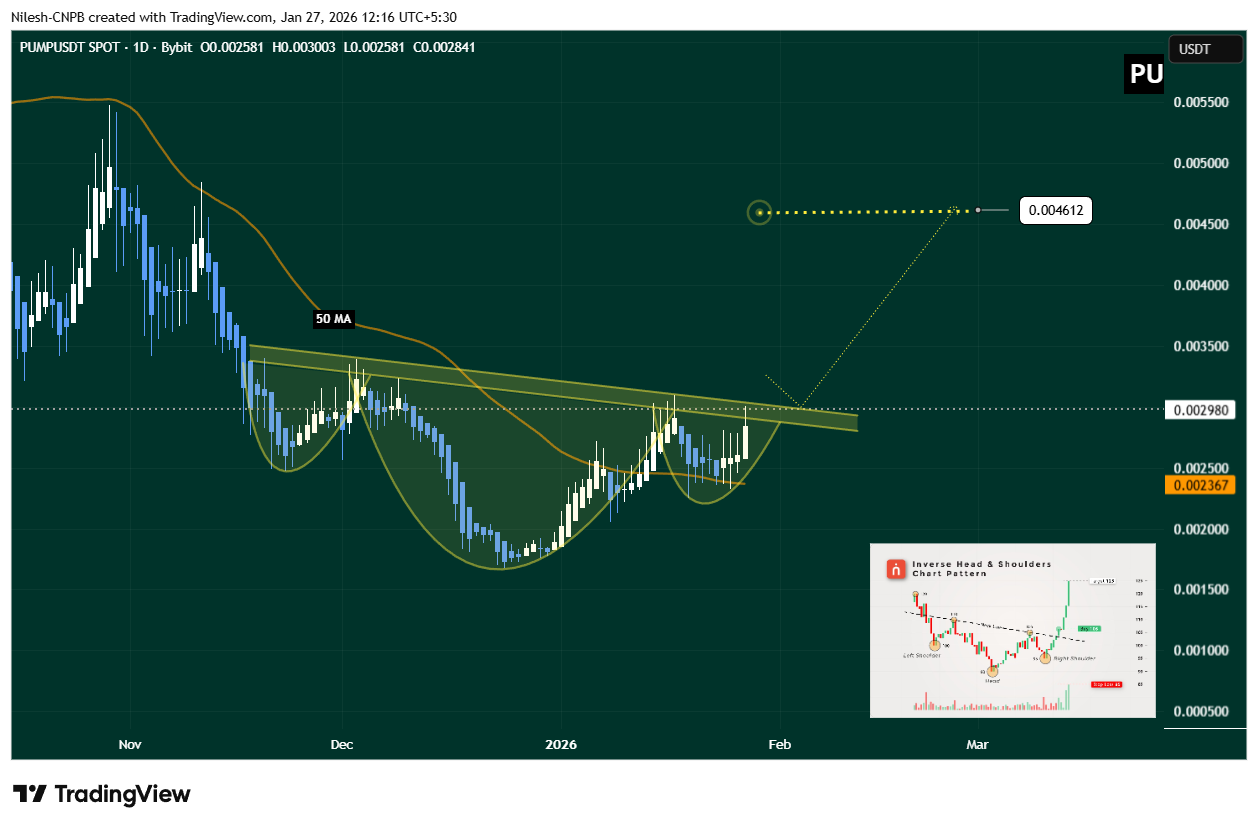
Pump.fun (PUMP) Daily Chart/Coinsprobe (Source: Tradingview)
This tightening price action near resistance often precedes a volatility expansion, suggesting a decisive move could be approaching.
What’s Next for PUMP?
For bullish momentum to gain confirmation, PUMP needs a strong daily close above the $0.003025 neckline, ideally followed by a successful retest of this zone as support. Such a move would validate the inverse head and shoulders breakout and signal a shift in short-term market structure.
Based on the measured move from the inverse head and shoulders pattern, a confirmed breakout could open the door for a price target near $0.004612 — representing a potential 53% upside from the breakout zone.
On the downside, failure to clear the neckline could lead to further consolidation. In that scenario, holding above the 50-day moving average and the $0.002367 support zone will be critical to keep the broader bullish setup intact.
Bottom Line
PUMP’s recent rally appears to be supported by a constructive chart pattern and improving momentum. As long as price continues to coil beneath neckline resistance while holding key support levels, the probability of a breakout remains elevated.
A decisive move above $0.003025 could mark the start of a fresh upside leg, while rejection would likely extend the current consolidation.
Disclaimer: The views and analysis presented in this article are for informational purposes only and reflect the author’s perspective, not financial advice. Technical patterns and indicators discussed are subject to market volatility and may or may not yield the anticipated results. Investors are advised to exercise caution, conduct independent research, and make decisions aligned with their individual risk tolerance.
About Author: Nilesh Hembade is the Founder and Lead Author of Coinsprobe, with over 5 years of experience in the cryptocurrency and blockchain industry. Since launching Coinsprobe in 2023, he has been providing daily, research-driven insights through in-depth market analysis, on-chain data, and technical research.
Disclaimer: The information on this page may come from third parties and does not represent the views or opinions of Gate. The content displayed on this page is for reference only and does not constitute any financial, investment, or legal advice. Gate does not guarantee the accuracy or completeness of the information and shall not be liable for any losses arising from the use of this information. Virtual asset investments carry high risks and are subject to significant price volatility. You may lose all of your invested principal. Please fully understand the relevant risks and make prudent decisions based on your own financial situation and risk tolerance. For details, please refer to
Disclaimer.
Related Articles
Elon Musk References Fuel Trading Surge in 'Asteroid' Crypto Token
Elon Musk's online activity revived interest in a cryptocurrency token known as "Asteroid crypto," causing increased trading and volatility on decentralized exchanges. Market reactions were driven by social media references, illustrating the token's sensitivity to influencer attention.
GateNews24m ago
BTC rises 0.69% over 15 minutes: spot buy-side strength and sustained whale accumulation on-chain reinforce the move
From 14:30 to 14:45 (UTC) on 2026-04-17, the Bitcoin (BTC) market saw clear signs of abnormal movement. The 15-minute candlestick return reached +0.69%, with the price ranging from 77455.4 to 78044.4 USDT and an amplitude of 0.76%. Short-term fluctuations increased market attention, trading volume expanded in parallel, and liquidity improved further.
The main driver behind this abnormal move was a clear strengthening of spot-market buy-side demand. According to on-chain and statistical data, from 14:00 to 15:00, BTC spot buys had the upper hand. Massive buy orders continued to push the price higher, while whale addresses (≥10,000 BTC holdings) were actively net-buying during this period. The inflow of large on-chain funds directly drove spot prices higher. In addition, CME Bitcoin futures open interest increased by 70%, yet there was no large-scale liquidation or forced selling, indicating that institutional capital was returning in an orderly manner and that futures leverage did not become the dominant source of pressure. The leading force behind this upswing came from the spot market, and any wait-and-see sentiment caused by shrinking ETF flows did not suppress short-term prices.
Meanwhile, on-chain data shows that network activity has continued to rise, and the distribution of holdings is becoming more concentrated. In the short term, the coordinated effect of whales and newly onboarded users amplified price elasticity. Benefiting from an increase in macro risk appetite in mid-April—along with dovish signals from the Bank of Japan coinciding with easing geopolitical tensions—BTC’s attractiveness as a risk asset improved, and investors’ risk appetite strengthened. In addition, although ETF net inflows fell to $4.2 million, there were no large outflows, providing bottom support for spot. Multiple factors converged to drive BTC’s short-term rebound within the 15-minute window.
It is worth noting that the SOPR data for short-term holders shows that some short-term capital is currently trading at a loss; if the price pulls back, there may be a risk of additional downside. Changes in institutional capital driven by shrinking ETF flows are also a potential trigger for volatility. The return of leveraged funds to the futures market is also worth watching. Investors should closely monitor key support levels, the movements of actively circulating on-chain funds, and changes in macro news, so they can grasp the market’s timing and stay up to date with more real-time market information.
GateNews58m ago
ADA Tests Key $0.230 Support While Upgrade Timeline Holds
Key Insights:
ADA trades at the wedge apex near $0.2387 as price compresses between $0.230 support and $0.245 resistance ahead of a decisive breakout move.
Protocol 11’s timeline remains intact despite the memory bug fix, keeping Cardano fundamentals stable while macro risks dominate short-t
CryptoNewsLand1h ago
Solana Targets $120 if Bulls Hold $87 Support; Technical Setup Shows Cup-and-Handle Pattern
Solana (SOL) is trading at $88.87, with a daily gain of 3.84%. Analysts indicate that maintaining support above $87 is crucial to potentially reach $120. Liquidation clusters influence price action, and a breakout above $107 could confirm upward momentum.
GateNews1h ago
