
Key Takeaways
-
Monad (MON) has dropped nearly 41% over the past two months but is showing early signs of stabilization.
-
Price action suggests a potential double bottom pattern forming near the $0.018 support zone.
-
Buyers have repeatedly defended the same support level, hinting at fading selling pressure.
-
A move above the 50-day moving average could strengthen the short-term bullish outlook.
-
A confirmed breakout above the $0.02970 neckline may open the door for a stronger recovery rally.
Monad (MON), the native token of the Monad Layer-1 blockchain, has been under pressure in recent weeks. The token is down roughly 41% over the past 60 days, driven by a slowdown in TVL growth and a decline in application-level revenue across the ecosystem.
However, sentiment may be starting to shift. MON posted a 12% bounce today, and more importantly, its price structure on the daily chart is beginning to show early signs of a bullish reversal — suggesting the downside momentum could be losing steam.
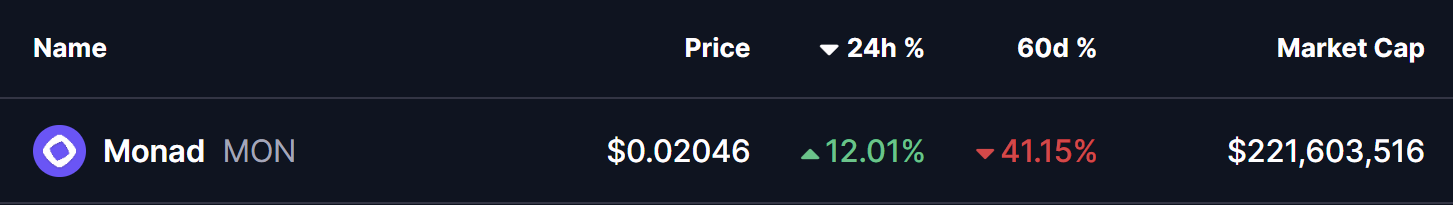
Source: Coinmarketcap
Double Bottom Pattern in Play
On the daily timeframe, MON appears to be forming a potential double bottom pattern, a classic bullish reversal structure that often develops near the end of extended downtrends.
The first bottom was formed when MON dropped toward the $0.018 support zone, followed by a rebound that carried price back toward the neckline resistance near $0.02970. That recovery attempt was rejected, sending MON back down to retest the same support level.
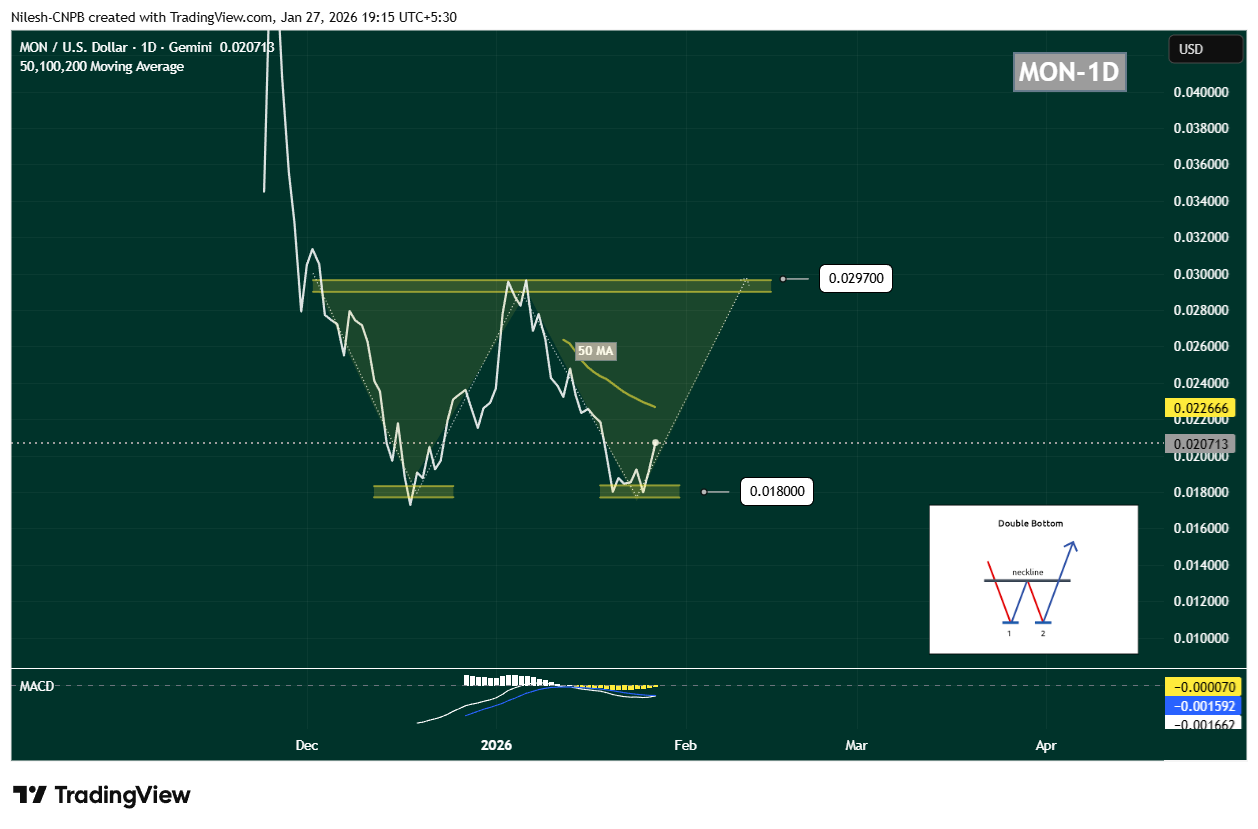
Monad (MON) Daily Chart/Coinsprobe (Source: Tradingview)
What’s notable this time is buyer behavior. Once again, demand emerged around $0.018, preventing a breakdown and forming the second bottom of the structure. MON is currently trading near $0.02071, indicating that selling pressure may be fading.
Momentum indicators are starting to support this view. The MACD is showing early signs of a potential bullish crossover, often seen as an initial signal that downside momentum is weakening and buyers may be preparing to step back in.
What’s Next for Monad (MON)?
For this bullish setup to gain credibility, MON needs to reclaim the 50-day moving average, which is currently positioned near $0.02266. A sustained move above this level would signal a shift in short-term momentum and improve the probability of a recovery rally.
If buyers manage to push price back toward the $0.02970 neckline, the market will be watching closely. A decisive breakout above this resistance, ideally followed by a successful retest, would confirm the double bottom pattern and open the door for a stronger upside move.
On the downside, the $0.018 support zone remains the most critical level to defend. A breakdown below this area would invalidate the bullish structure and likely expose MON to another leg of downside or extended consolidation.
Bottom Line
Despite recent weakness, MON’s technical structure is starting to look constructive. The repeated defense of identical lows, the emergence of a double bottom pattern, and improving momentum signals suggest that Monad could be approaching a potential turning point.
If key support continues to hold and the token reclaims its short-term moving averages, MON may be setting the stage for a recovery phase — especially if broader market conditions stabilize in the days ahead.
Disclaimer: The views and analysis presented in this article are for informational purposes only and reflect the author’s perspective, not financial advice. Technical patterns and indicators discussed are subject to market volatility and may or may not yield the anticipated results. Investors are advised to exercise caution, conduct independent research, and make decisions aligned with their individual risk tolerance.
About Author: Nilesh Hembade is the Founder and Lead Author of Coinsprobe, with over 5 years of experience in the cryptocurrency and blockchain industry. Since launching Coinsprobe in 2023, he has been providing daily, research-driven insights through in-depth market analysis, on-chain data, and technical research.
Disclaimer: The information on this page may come from third parties and does not represent the views or opinions of Gate. The content displayed on this page is for reference only and does not constitute any financial, investment, or legal advice. Gate does not guarantee the accuracy or completeness of the information and shall not be liable for any losses arising from the use of this information. Virtual asset investments carry high risks and are subject to significant price volatility. You may lose all of your invested principal. Please fully understand the relevant risks and make prudent decisions based on your own financial situation and risk tolerance. For details, please refer to
Disclaimer.
Related Articles
Cardano Faces $9.9M Liquidation Risk as ADA Hovers Near Key Support
Cardano is currently trading near $0.264, facing potential liquidation risks if it drops to $0.253. While on-chain data indicate reduced realized losses, the market remains in a distribution phase, hindering recovery. Resistance challenges persist between $0.2856 and $0.300, necessitating a stronger rally for upside movement.
CryptoFrontNews27m ago
Bittensor Jumps 20% After Jensen Huang Backs Distributed AI
Key Insights:
Bittensor surged over 20% after NVIDIA CEO Jensen Huang highlighted its distributed AI training, drawing strong attention from both crypto and technology markets.
The TAO price broke above the Bull Market Support Band for the first time since November, signaling a potential
CryptoNewsLand53m ago
Zcash Holds Key Support After 18% Drop From Weekly Peak
Key Insights:
The Zcash price dropped over 18% to $232, now testing a key trendline support that may determine short-term direction and potential recovery strength.
Bullish RSI divergence and a green Supertrend suggest weakening selling pressure, with upside targets at $265 and $300 if suppo
CryptoNewsLand1h ago
Did we win or lose the war? Trump: We profited.
Although it is difficult to evaluate his presidential abilities, Trump has demonstrated outstanding performance in manipulating financial markets. He uses his statements to influence market fluctuations, causing large amounts of capital to flow in and out, revealing a combination of his trading skills and political strategies. By shaping the stock market performance to gain political benefits while avoiding legal risks associated with direct profits, he navigates skillfully between power and wealth.
金色财经_1h ago
The reasons for gold's rise may be down to just 0.5
The article discusses recent gold price fluctuations and multiple reasons for its recent gains, including safe-haven demand, inflation expectations, and China's purchasing power. The author argues that although gold is currently affected by speculative behavior, its safe-haven properties and inflation expectations are weakening, while China's pace of accumulation is slowing. As a result, the momentum for future gold price increases is insufficient, and a cautious stance is recommended.
金色财经_1h ago
