
RENDER is finally showing signs of a shift on the 4-hour chart. After weeks of grinding lower inside a falling wedge, price has pushed through the upper trendline and now, it moves away from it. That matters, because this kind of structure usually breaks when selling pressure runs out instead of when sellers are in control.
What stands out is how the breakout played out. Volatility had been tightening, price action was compressing, and each sell-off was doing less damage than the last. Once buyers stepped in, the RENDER price broke higher and did not slip back into the wedge immediately…
- Why This RENDER Falling Wedge Break Is Getting Attention
- The RENDER Daily Chart Adds Confirmation
- What Needs to Happen Next
Why This RENDER Falling Wedge Break Is Getting Attention
On the 4-hour chart shared by Clifton a falling wedge is showing up and this normally happens near the end of corrective phases, and that seems to be the case here.
Even though the RENDER price was still printing lower highs, the downside momentum was fading. Sellers were pushing, but they were not getting much in return.
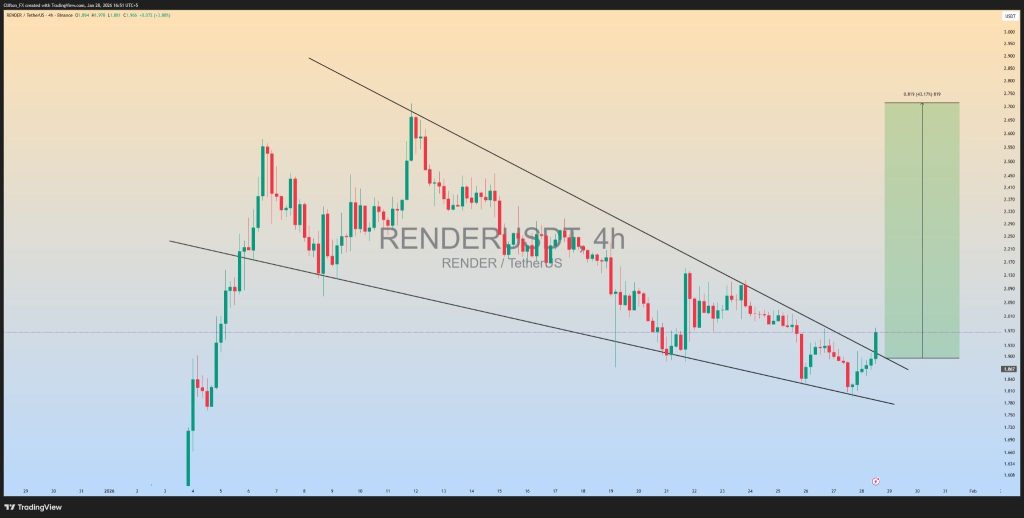
Source: X/@clifton_ideas
Once price cleared the top of the wedge, it opened space for a broader move. The upside projection on the chart highlights how much room the RENDER price could have if momentum continues to build.
It does not mean price shoots straight up, but it does show that this breakout is coming from a compressed base and not an overheated rally. As long as the RENDER price stays above the former wedge resistance, the breakout structure remains valid.
The RENDER Daily Chart Adds Confirmation
The daily chart helps put the move into context. The RENDER price dipped into a key Fibonacci support zone between $1.75 and $1.85, briefly tagging around $1.81 before buyers stepped in.
The price didn’t continue going lower, it quickly bounced back above $1.90, which is exactly what a clean support test usually looks like.
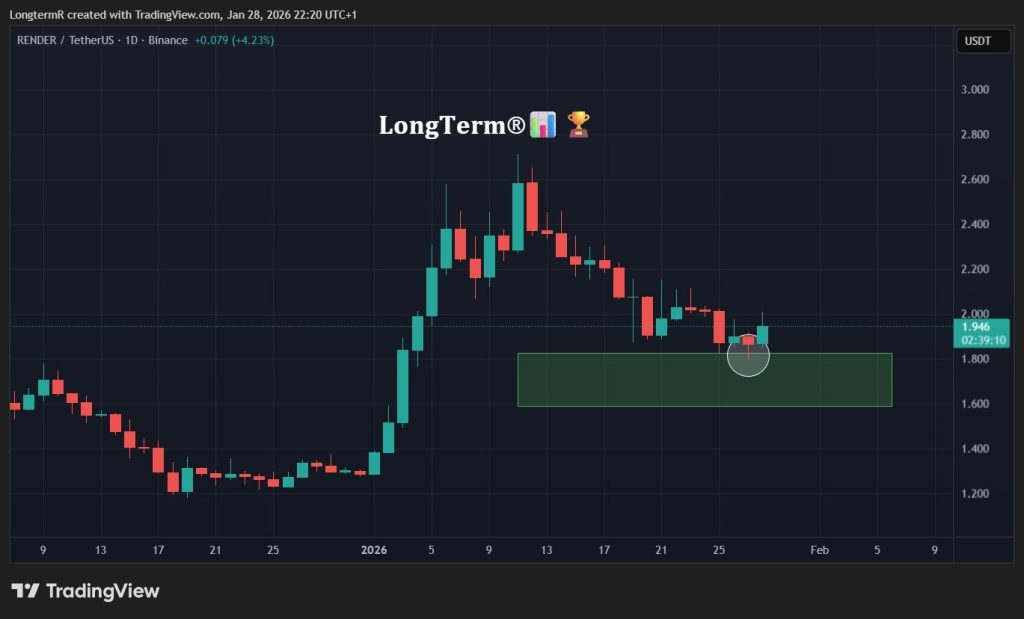
Source: X/@LongTermR
That kind of response suggests there was real demand waiting at those levels. It also supports the idea that this pullback was more of a reset than the beginning of a deeper decline, especially with buyers stepping in so decisively.
With the daily bounce lining up nicely with the 4-hour breakout, the RENDER price continues to hold a constructive structure as long as it stays above the $1.80 zone.
Kaspa (KAS) Price Prediction for February: Recovery Remains Unlikely_**
What Needs to Happen Next
Right now, the RENDER price is sitting at a clear decision point. The 4-hour chart is building steam, and on the daily chart, the support continues to hold at the critical price range of $1.80–$1.85.
In order to sustain the bullish view, the price needs to hold above the recent higher low at $1.81 and not fall back below the former breakout range at $1.85. As long as that happens, the structure remains constructive.
However, if the buyers continue to be on the upper end, RENDER could continue to move towards even stronger resistance levels of $2.10 and $2.30, which were out of reach during the fall.
But if the support levels continue to fall, the chances are that the stock will continue to move sideways between $1.75 and $1.95. The momentum is changing, and the key will be to see if the stock can move above $2.00 and hold on to the level.
Disclaimer: The information on this page may come from third parties and does not represent the views or opinions of Gate. The content displayed on this page is for reference only and does not constitute any financial, investment, or legal advice. Gate does not guarantee the accuracy or completeness of the information and shall not be liable for any losses arising from the use of this information. Virtual asset investments carry high risks and are subject to significant price volatility. You may lose all of your invested principal. Please fully understand the relevant risks and make prudent decisions based on your own financial situation and risk tolerance. For details, please refer to
Disclaimer.
Related Articles
Bitcoin risks 50% drop as BTC’s positive correlation with US stocks grows
Bitcoin (BTC) erased much of its US-Iran war-driven gains this week, moving back in sync with the broader downtrend in risk assets, mainly US equities.
Key takeaways:
Bitcoin’s positive flip in S&P 500 correlation has historically preceded average declines of around 50% since 2018.
BTC
Cointelegraph16m ago
Impact of the Current US–Israel–Iran War on Cryptocurrency: Market Volatility, Bitcoin Trends & Future Outlook (2026)
🌍 Introduction
The ongoing geopolitical conflict involving the United States, Israel, and Iran has created shockwaves across global financial markets. From rising oil prices to falling stock indices, every asset class is being affected — including cryptocurrency.
In 2026, crypto is no
Cryptoknowmics20m ago
BTC Price Fluctuation Analysis
# BTC 2026-03-23 11:00–11:15(UTC)Price Anomaly Deep Attribution Report
## I. Executive Summary and Core Conclusions
During the time window of 2026-03-23 11:00–11:15(UTC), BTC price return was +3.51%, showing significant anomaly. This report systematically traces the causes of price anomaly through quantitative indicators including on-chain data, trading volume, position changes, and capital flows, combined with market structure and behavioral analysis. Conclusions show that this round of anomaly was primarily driven by institutional capital inflows (ETF net purchases), futures market leverage
GateNews30m ago
Crypto Market Declines As Fear Grips Investors
The crypto market is down, with a total market cap of $2.36T. Bitcoin and Ethereum have dipped by 0.82% and 2.47%, respectively. Nonetheless, some altcoins have surged significantly. DeFi TVL has decreased, while NFT sales volume has increased. Blockchain social apps are gaining traction amid geopolitical tensions.
BlockChainReporter42m ago
Solana Price Under Pressure, Can Institutional Buying Support Help SOL Return to $100?
Solana (SOL) has recently hovered around $86-87, declining nearly 7% over the past week, related to overall crypto market weakness. Clear classification of crypto assets by U.S. regulators benefits institutional investors. Capital flows show robust institutional demand, with continuous net inflows into Solana ETFs. Technical analysis shows SOL below the $90 resistance level, with support at $85. Investors should monitor institutional dynamics and technical indicators to gauge short-term trends.
GateNews1h ago
Bitcoin MACD Reignites Red Alert, Bulls May Face Risk of Sharp Drop
Bitcoin bulls should be alert to the sell signal indicated by the MACD indicator. Recent weakening momentum may cause a price correction. Historical patterns show that whenever the MACD drops below the zero line, prices tend to fall sharply. Given the tense geopolitical situation, traders should monitor technical indicator changes, manage risks appropriately, and operate cautiously.
GateNews1h ago
