
Key Takeaways
-
SAND price is showing early signs of stabilization after recent downside pressure.
-
Buyers appear to be defending a key support zone, hinting at a potential short-term rebound.
-
A breakout above nearby resistance could open the door for a stronger recovery move.
Gaming-focused crypto tokens are back in the spotlight after Axie Infinity (AXS) posted a sharp rally of over 16% in a single day and more than 246% over the past month, reigniting optimism around the gaming narrative. Riding this renewed momentum, Sandbox (SAND) has also stepped into focus, climbing nearly 45% as overall market sentiment turns constructive.
Beyond the recent price bounce, the technical structure on the chart is starting to tell a bigger story, hinting that SAND may be setting up for a bullish continuation move.
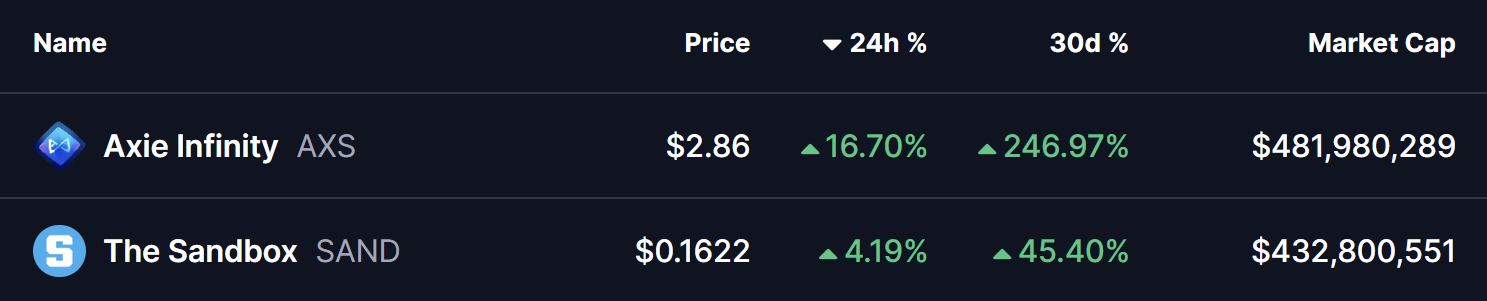
Source: Coinmarketcap
Descending Broadening Wedge Pattern in Play
On the daily timeframe, SAND is trading within a descending broadening wedge — a bullish reversal pattern that often develops during corrective phases before a trend shift. This structure reflects increasing volatility, with price gradually compressing while buyers quietly regain control.
During the latest pullback, SAND successfully retested the lower boundary of the wedge near the $0.11 zone, an area that has repeatedly acted as strong demand. Buyers stepped in aggressively at this level, triggering a rebound that pushed price toward $0.1711, placing SAND right near the wedge’s upper resistance trendline.
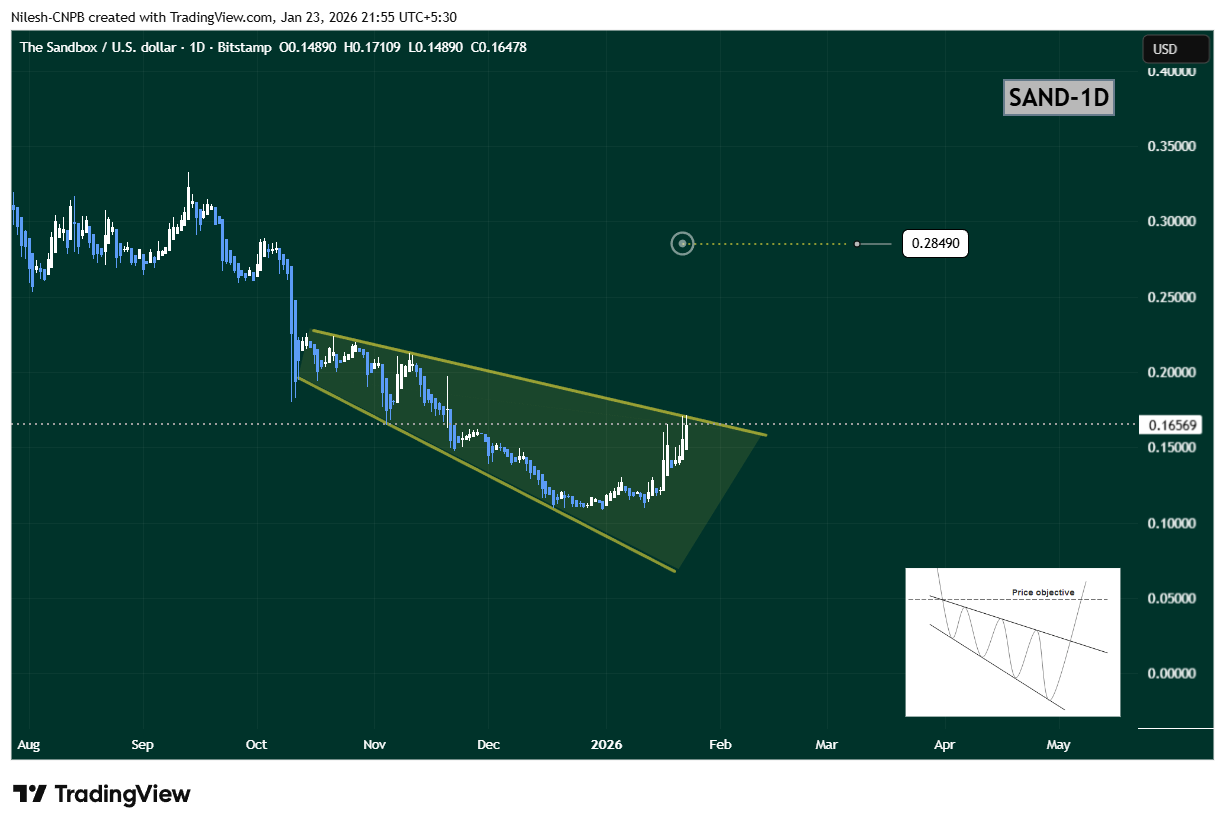
Sandbox (SAND) Daily Chart/Coinsprobe (Source: Tradingview)
The steady rise toward this upper boundary suggests growing bullish momentum and increasing breakout pressure.
What’s Next for SAND?
If buyers manage to push SAND above the upper wedge resistance near $0.1711, it would confirm a bullish breakout from the pattern. In that scenario, the chart opens the door for a move toward the $0.2849 target, which aligns with the measured move of the wedge and represents roughly 73% upside from current levels.
However, if price faces rejection at resistance, SAND could continue consolidating within the wedge structure. In that case, the $0.13–$0.14 region will act as an important short-term support zone to watch.
Bottom Line
SAND’s overall technical structure remains constructive. With a bullish descending broadening wedge in play, buyers defending key support, and gaming tokens gaining renewed attention, Sandbox appears to be positioning for a potential breakout. A confirmed move above resistance could mark the beginning of a stronger upside phase in the sessions ahead.
Disclaimer: The views and analysis presented in this article are for informational purposes only and reflect the author’s perspective, not financial advice. Technical patterns and indicators discussed are subject to market volatility and may or may not yield the anticipated results. Investors are advised to exercise caution, conduct independent research, and make decisions aligned with their individual risk tolerance.
About Author: Nilesh Hembade is the Founder and Lead Author of Coinsprobe, with over 5 years of experience in the cryptocurrency and blockchain industry. Since launching Coinsprobe in 2023, he has been providing daily, research-driven insights through in-depth market analysis, on-chain data, and technical research.
Disclaimer: The information on this page may come from third parties and does not represent the views or opinions of Gate. The content displayed on this page is for reference only and does not constitute any financial, investment, or legal advice. Gate does not guarantee the accuracy or completeness of the information and shall not be liable for any losses arising from the use of this information. Virtual asset investments carry high risks and are subject to significant price volatility. You may lose all of your invested principal. Please fully understand the relevant risks and make prudent decisions based on your own financial situation and risk tolerance. For details, please refer to
Disclaimer.
Related Articles
Bitcoin finds stability at 2023 investor cost basis, echoing past cycle
Bitcoin support has recently aligned with the 2023 average realized price of approximately $63,700. This level has held during price fluctuations and mirrors past cycles. Current data shows newer cohorts are facing underwater positions, while the aggregate realized price indicates potential support at $54,000 if prices decline further.
CoinDesk14m ago
Bitcoin Reclaims $68.4K, Tests Critical $71.4K Resistance
_Bitcoin reclaimed $68.4K support, filled the CME gap at $70.1K, and now tests $71.4K resistance. Bears stay in control below that level._
Bitcoin bounced off the 68.4K level and climbed toward 71.4K. The move came after the CME futures gap at 70.1K got filled. Structure, though, still reads
LiveBTCNews26m ago
Gate Index BVIX Hits "Panic Subsiding" Signal, US Stock Panic Index VIX Falls in Sync
On March 24, Gate News reported that the BVIX index declined 6.05% to 53.25, with sentiment showing "panic receding," while EVIX fell 4.68% to 76.12, with sentiment "easing." Meanwhile, the VIX index dropped to 25.02, with 24-hour trading volume surging 152.96%.
GateNews46m ago
Analysts Grow More Confident Over Bitcoin’s Final Rally in 2026, Bullish Then Bearish
Analysts grow more confident over Bitcoin’s final rally in 2026.
A bullish rally is expected first before a major fall in prices.
The price of Bitcoin is expected to fall as far as the $30,000 price range.
The crypto community is once again pleased to see the price of BTC trading over t
CryptoNewsLand1h ago
Bitcoin Faces Two Price Scenarios as Strait of Hormuz Tensions Dominate Oil Market
Recent market analysis from Wintermute indicates that geopolitical tensions in the Strait of Hormuz could significantly impact Bitcoin prices in the short term. If transportation normalizes and oil stabilizes around $100 per barrel, Bitcoin might test resistance levels between $74,000 and $76,000. Conversely, if shipping restrictions persist or conflicts escalate, Bitcoin could drop to around $60,000 due to increased macroeconomic pressure and cautious investor sentiment.
TapChiBitcoin1h ago
XRP Price Warning: Drop to $0.87 Before Ripping Higher – Here’s the Analyst’s Plan
Analyst TARA's Elliott Wave analysis suggests that XRP may drop to $0.87 before a significant rally, indicating the current gains could be a fakeout. Traders should watch for a potential bounce to $1.51, but be prepared for further declines to $1.12 or $0.87 as strategic accumulation zones.
CaptainAltcoin1h ago
