
Key Takeaways
-
Avalanche (AVAX) has dropped over 16% in the past week, reflecting broader market weakness.
-
The 4H chart shows a Bullish Shark harmonic pattern, often associated with trend reversals.
-
Price is currently hovering near the $11.88 support, a critical zone for pattern validation.
-
If support holds, AVAX could rebound toward $13.39, with a higher upside target near $14.94.
-
A breakdown below the current support would invalidate the bullish setup and extend downside risk.
The cryptocurrency market remains under notable selling pressure as the total crypto market capitalization slipped 1.79% over the past 24 hours. This broader pullback triggered heightened volatility across digital assets, leading to more than $807 million in liquidations, with long positions bearing the brunt of the losses.
This wave of downside pressure has spilled into major altcoins, including Avalanche (AVAX). The token is trading slightly in the red and has dropped over 16% in the past seven days. However, beyond the red candles, AVAX’s chart is beginning to reveal a technical structure that suggests downside momentum may be weakening — and a rebound could be forming.
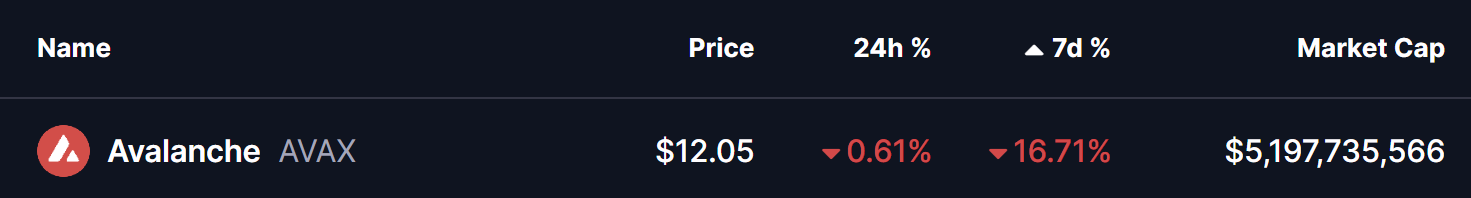
Source: Coinmarketcap
Harmonic Pattern Hints at Potential Upside
On the 4-hour timeframe, AVAX appears to be completing a Bullish Shark harmonic pattern, a formation that often emerges near market lows when selling pressure becomes exhausted. This pattern typically signals a potential trend reversal once its final leg forms within a defined demand zone.
The structure began with the initial O–X impulse around the $12.22 area, followed by a sharp rally that peaked near $14.83 at point X. Price then retraced aggressively toward point A before making another push higher to form point B near $14.94. That move, however, failed to sustain, triggering the current corrective leg.
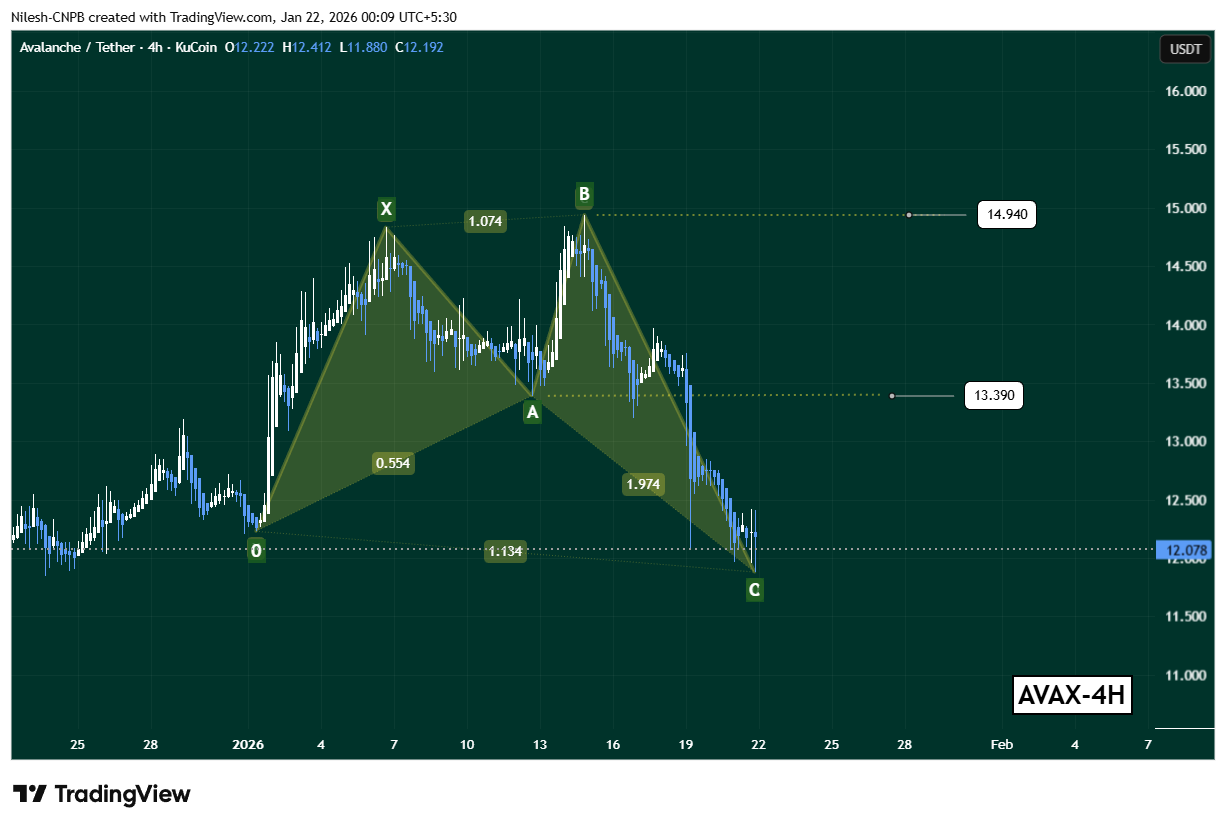
Avalanche (AVAX) 4H Chart/Coinsprobe (Source: Tradingview)
AVAX has since slid steadily lower, with price now hovering near $11.88, a level that could represent the C-point completion of the Shark pattern. This zone is technically important, as it’s where buyers often step in if the pattern is to play out bullishly.
What’s Next for AVAX?
If this harmonic structure continues to unfold as expected, AVAX could be positioning for a rebound from current levels. The first key upside level to watch sits around $13.39, which aligns closely with the prior A-point of the formation and serves as a near-term recovery target.
A stronger bullish follow-through could eventually bring the $14.94 region back into focus — the B-leg high and a significant resistance zone where sellers previously stepped in.
That said, the bullish outlook remains conditional. A sustained breakdown below the $11.88 support zone would invalidate the Shark pattern and shift momentum back in favor of the bears, opening the door for further downside continuation.
Bottom Line
AVAX may still be under pressure, but the emerging Bullish Shark harmonic pattern suggests selling momentum could be nearing exhaustion. As long as price holds above the current support zone, the setup favors a short-term rebound toward $13.39 and potentially $14.94. However, confirmation will depend on buyer response at current levels — making the next few sessions critical for Avalanche’s near-term direction.
Disclaimer: The views and analysis presented in this article are for informational purposes only and reflect the author’s perspective, not financial advice. Technical patterns and indicators discussed are subject to market volatility and may or may not yield the anticipated results. Investors are advised to exercise caution, conduct independent research, and make decisions aligned with their individual risk tolerance.
About Author: Nilesh Hembade is the Founder and Lead Author of Coinsprobe, with over 5 years of experience in the cryptocurrency and blockchain industry. Since launching Coinsprobe in 2023, he has been providing daily, research-driven insights through in-depth market analysis, on-chain data, and technical research.
Disclaimer: The information on this page may come from third parties and does not represent the views or opinions of Gate. The content displayed on this page is for reference only and does not constitute any financial, investment, or legal advice. Gate does not guarantee the accuracy or completeness of the information and shall not be liable for any losses arising from the use of this information. Virtual asset investments carry high risks and are subject to significant price volatility. You may lose all of your invested principal. Please fully understand the relevant risks and make prudent decisions based on your own financial situation and risk tolerance. For details, please refer to
Disclaimer.
Related Articles
Hyperliquid Sees Sharp Volume Drop as Netflows Turn Deeply Negative
Hyperliquid’s derivatives volume dropped sharply, with some platforms reporting declines above 60%, signaling reduced speculative activity and weakening trader engagement across markets.
Netflows turned deeply negative near -285%, reflecting sustained capital withdrawal as both spot and
CryptoNewsLand2m ago
Solana Holds Key Support as Range Tightens Below $90
Key Insights
Solana trades near $80 support as price compresses within a tight range, reflecting reduced volatility and balanced market participation among traders.
Persistent lower highs and price below major moving averages confirm ongoing bearish structure, limiting recovery attempts
CryptoNewsLand1h ago
Crypto Market Displays Mixed Signals As Fear Persists
The crypto market shows mixed signals with a 0.34% market cap increase to $2.3T, while trading volume fell by 16.99%. Bitcoin rose by 0.50% to $66,896.80, and Ethereum dropped by 0.18% to $2,053.15. Key gainers include PEPE, TRUMP IP, and TRUMP MOG, which saw significant price increases. DeFi TVL decreased by 0.35%, and NFT sales volume fell by 5.18%. Notably, Drift Protocol experienced a 40% loss after a breach, and Charles Schwab plans Bitcoin and Ethereum spot trading in 2026.
BlockChainReporter1h ago
Hyperliquid Price Gains as Futures Activity Lifts Momentum
Key insights
Hyperliquid open interest climbed above one point six billion dollars, signaling stronger derivatives participation and reinforcing current price momentum across markets.
Commodity perpetuals and event contracts increased trading activity, pushing daily volumes past two point fo
CryptoNewsLand1h ago
HUMA Surpasses $0.01428 As Falling Wedge Structure Sets Up a 300% Breakout
Market analyst RoccoBullBottom indicates Huma Finance (HUMA) is stabilizing after a downtrend, trading at $0.01428. With key support at $0.01403, bullish patterns suggest HUMA may soon experience a significant price surge.
BlockChainReporter3h ago
Early ETH Accumulation Hints at Breakout—Can Momentum Hold?
Ethereum shows early accumulation, with most holders near breakeven and selling pressure easing.
Taker Buy/Sell Ratio rising indicates growing demand and selective buying across exchanges.
Sustained momentum above key levels could trigger a breakout toward higher price targets.
At press
CryptoNewsLand3h ago
