AI Token (AI) has collectively adjusted along with Bitcoin (BTC) and the overall cryptocurrency market for three consecutive days as geopolitical tensions escalate around the US’s intention to acquire Greenland. However, some representatives within the AI group are showing signs of resilience, attempting to establish support zones and aiming for a scenario to retest key resistance levels.
ICP Faces Pressure Around 20-Day and 50-Day EMA
Internet Computer (ICP) is currently struggling to defend a critical support zone, where the 20-day and 50-day exponential moving averages (EMA) converge. Selling pressure increased after the price was strongly rejected at the resistance zone around $4.41 — an area that becomes even more “rigid” when it coincides with the 200-day EMA.
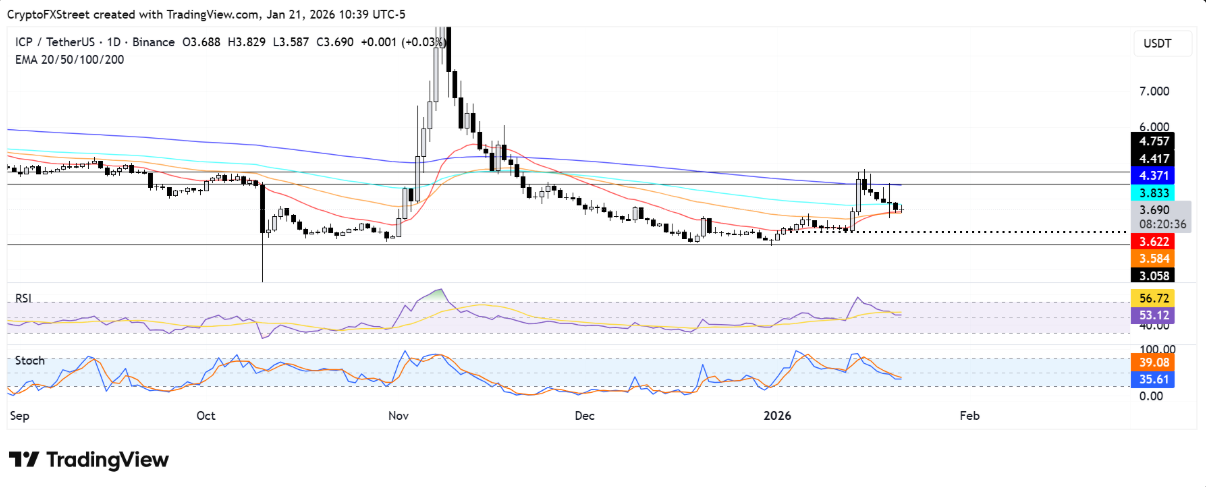 Daily ICP/USDT Chart | Source: TradingViewIn a negative scenario, if ICP loses the EMA 20 and EMA 50 support zones, the price is likely to retreat to test the psychological level of $3.0. Further down, the $2.70 zone could become the “last shield,” acting as a buffer to absorb selling pressure if the downtrend continues strongly.
On the other hand, the recovery outlook is only truly supported when ICP maintains a steady upward momentum above the 100-day EMA, opening up the possibility of returning to challenge the $4.41 resistance zone.
In terms of momentum, the RSI indicator is oscillating around the neutral threshold, while the Stochastic Oscillator remains below the midline — signals that the upward momentum is weakening and the market still lacks clear breakout strength.
Bittensor Holds Support at $230, Aiming for Downtrend Resistance
Bittensor (TAO) is striving to defend an important support zone around $230 after the price fell below both the 20-day and 50-day EMAs. Over the past week, this AI token has maintained a clear downtrend, originating from failure to approach the $305 resistance zone — an area coinciding with the 100-day EMA and acting as a “wall” hindering upward movement.
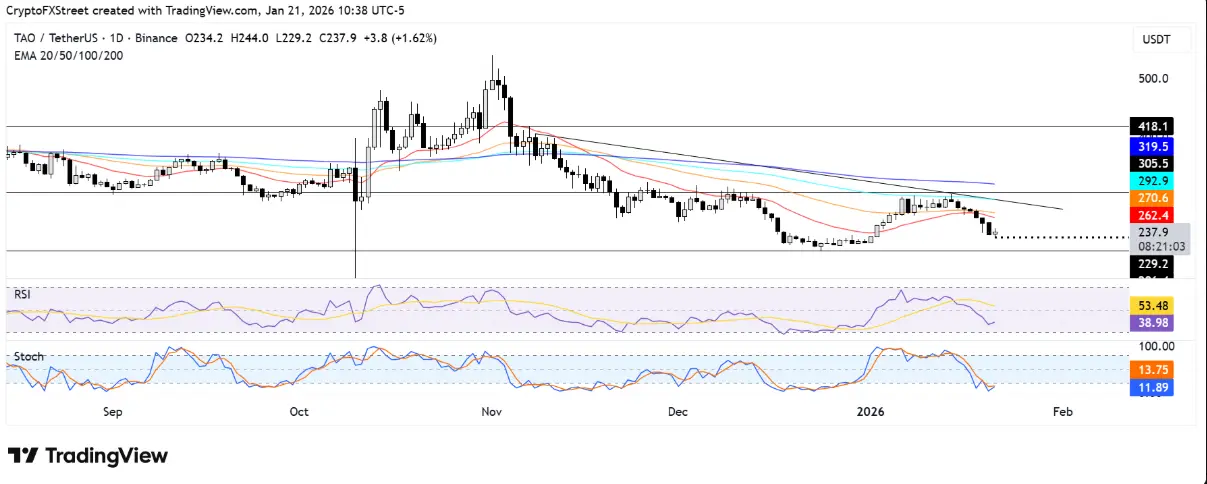 TAO/USDT Daily Chart | Source: TradingViewIn a positive scenario, if TAO maintains the $230 level and quickly recovers the 50-day EMA, the price could open up opportunities to test the downtrend line formed since November 8. Conversely, losing this support zone would increase selling pressure, pushing TAO back to a lower support area around $206.
Regarding technical indicators, RSI is currently below the neutral threshold, reflecting weakening momentum. Meanwhile, the Stochastic Oscillator has entered the oversold zone — a factor that could trigger a short-term technical rebound if buying interest returns.
###Render Bounces at $1.86, Testing 100-Day EMA
Render (RENDER) is in the process of testing the 100-day EMA after bouncing from the support zone at $1.86 — an area that coincides with the 50-day EMA, temporarily halting the previous decline.
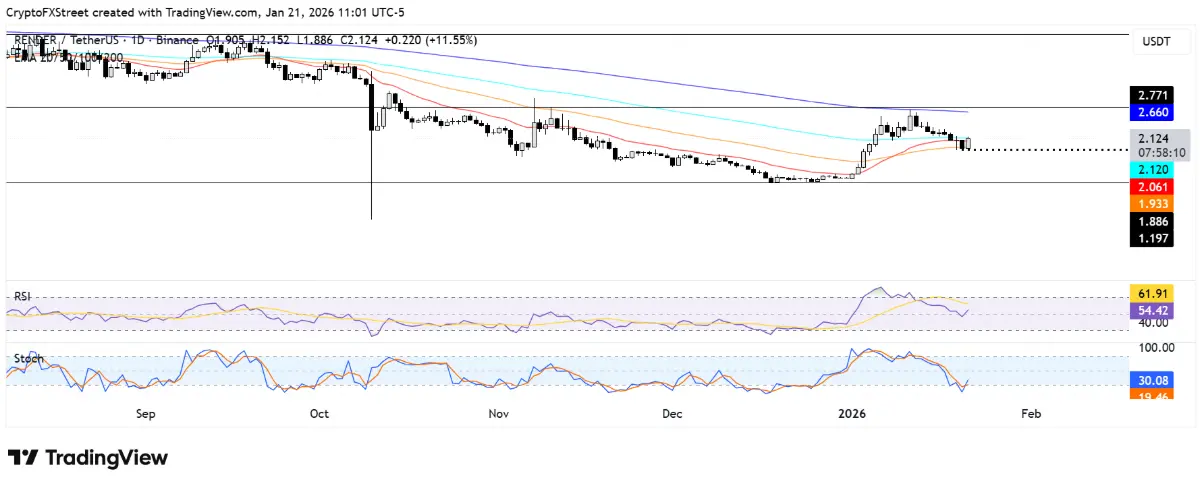 Daily RENDER/USDT Chart | Source: TradingViewIn a positive scenario, if the price can break through and sustain above the 100-day EMA, RENDER is likely to target the resistance zone at $2.77, located just above the 200-day EMA. Conversely, if the $1.86 support level is broken, selling pressure could push the price down to around $1.19.
Regarding momentum, the RSI indicator has recovered from the neutral zone, while the Stochastic Oscillator has exited the oversold region, indicating weakening selling pressure and signs of a slowdown in the downtrend.
Disclaimer: The information on this page may come from third parties and does not represent the views or opinions of Gate. The content displayed on this page is for reference only and does not constitute any financial, investment, or legal advice. Gate does not guarantee the accuracy or completeness of the information and shall not be liable for any losses arising from the use of this information. Virtual asset investments carry high risks and are subject to significant price volatility. You may lose all of your invested principal. Please fully understand the relevant risks and make prudent decisions based on your own financial situation and risk tolerance. For details, please refer to
Disclaimer.
Related Articles
Ondo Gains After Franklin Templeton ETF Tokenization Deal
Key Insights
Ondo gained eight percent after partnering with Franklin Templeton, boosting visibility and signaling deeper integration between traditional finance and blockchain-based investment products globally.
Tokenized ETFs will enable round-the-clock trading through crypto wallets,
CryptoNewsLand15m ago
Dogecoin Holds Key Support as 23% YTD Drop Deepens
Key Insights:
Dogecoin has declined over 23% year to date, with broader macroeconomic pressure and weak crypto sentiment driving sustained selling across major digital assets.
The $0.07 to $0.08 range remains a historically strong support zone, previously triggering sharp recoveries and
CryptoNewsLand25m ago
XRP Price Compresses Near $1.40 as Traders Brace for Breakout
Key Insights
XRP trades within a tightening triangle, with resistance at $1.40 and support near $1.30 shaping a decisive breakout setup expected in early April.
Rising derivatives volume and open interest indicate fresh positioning, while liquidation data highlights repeated failed breakout
CryptoNewsLand30m ago
Bitcoin Price Prediction: Is $60K Inevitable for BTC Amid Market Weakness?
Bitcoin (BTC) continues in a broad consolidation phase following the steep declines earlier this year. The asset remains confined in a horizontal range that signals short-term indecision among market participants. While attempts to retest higher resistance levels around $75k have been met with
CryptoPotato33m ago
This Oversold Signal Has Triggered 350%, 1,800%, and 2,700% Bitcoin Surges Before
Although it has performed relatively well since the war in the Middle East broke out nearly a month ago, and has dwarfed gold in terms of gains within this period, bitcoin is far from its best shape observed in October last year.
The cryptocurrency trades nearly 50% below its all-time high of
CryptoPotato40m ago
Bittensor (TAO) Rises 10% Daily as Bulls Eye Further Breakout
The cryptocurrency market registered a slight rebound over the past 24 hours, with Bittensor (TAO) being the best performer (at least among the top 100 club) today.
Market experts expect the bullish momentum to continue, projecting more substantial gains in the near future.
TAO Jumps
CryptoPotato51m ago
