
Key Highlights
-
Litecoin (LTC) price has declined nearly 21% in the past 60 days, but its long-term structure remains intact.
-
Weekly and monthly charts show Litecoin closely mirroring Monero’s (XMR) historical bullish fractal.
-
Both LTC and XMR peaked in 2017 and 2021 and formed macro higher lows after the 2022 bear market bottom.
-
LTC is currently testing a long-term rising support trendline near the $75 region.
-
If the fractal continues to play out, Litecoin could be setting up for a larger upside move.
Litecoin (LTC) may have struggled in the short term, but zooming out tells a far more interesting story.
Over the past 60 days, LTC has slipped roughly 21%, reflecting broader market hesitation and declining momentum. However, beneath this pullback, Litecoin’s higher-timeframe structure is beginning to resemble Monero’s (XMR) long-term bullish setup—a fractal that has caught the attention of several analysts.
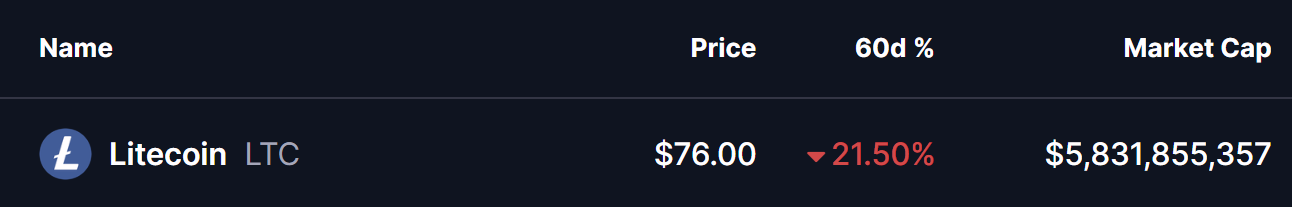
Source: Coinmarketcap
The comparison suggests that Litecoin could be quietly positioning itself for a larger move, similar to what Monero has already started to deliver.
Litecoin and Monero: A Fractal Years in the Making
According to a weekly chart shared by crypto analyst CryptoBullet, Litecoin’s structure closely mirrors Monero’s historical price behavior across multiple market cycles.
Both assets:
-
Peaked during the same periods in 2017 and again in 2021
-
Printed slightly higher highs during the 2021 cycle
-
Formed macro higher lows following the 2022 bear market bottom
This is a critical observation. Since the 2022 lows, Litecoin has displayed relative strength, maintaining a structure that aligns almost step-by-step with XMR’s longer-term bullish path. Monero has already begun breaking higher from this formation, which raises the question: Is Litecoin simply lagging behind?

XMR and LTC Weekly Fractal Chart/Credits: @CryptoBullet1 (X)
Fractal patterns like these don’t guarantee identical outcomes, but they often highlight market psychology, especially when two assets have matured through multiple cycles.
Monthly Chart Signals: Long-Term Support in Focus
On the monthly timeframe, analyst @_CryptoSurf highlights another important similarity.
Litecoin is currently testing its long-term rising support trendline near the $75 region, the same structural zone that historically marked accumulation phases during prior cycles. This mirrors Monero’s own behavior before its recent upside expansion.
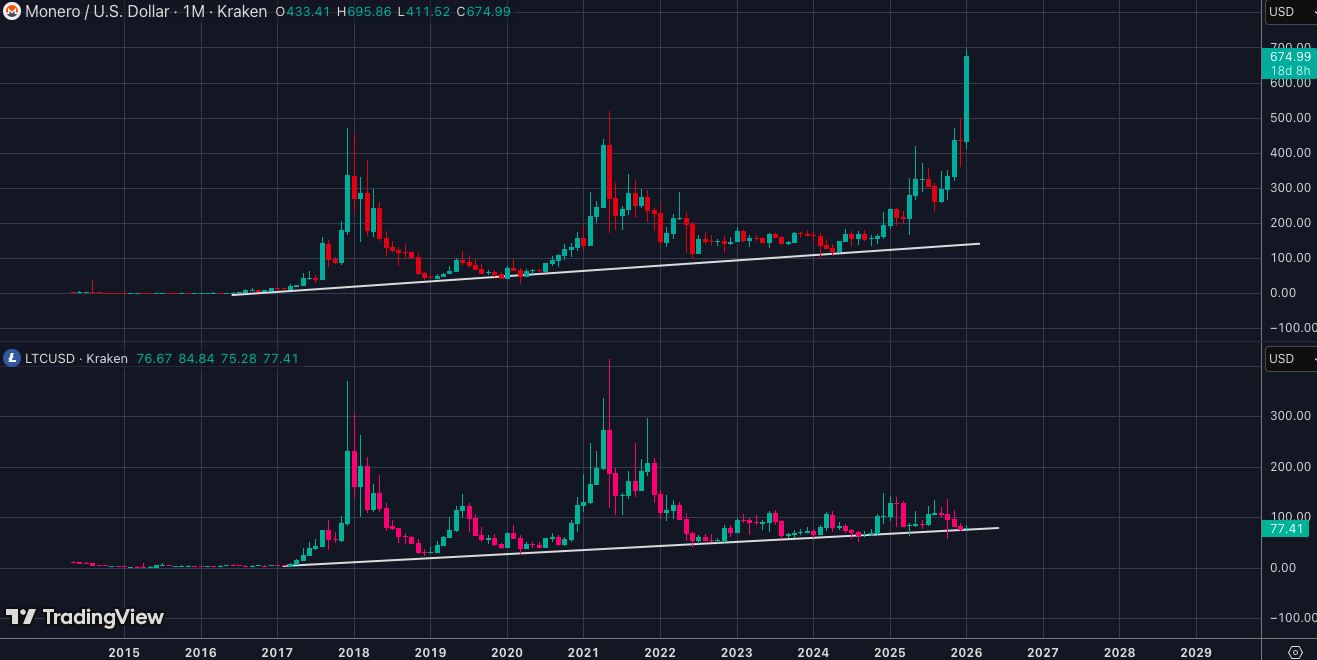
_XMR and LTC Monthly Fractal Chart/Credits: @CryptoSurf (X)
As long as this trendline holds, Litecoin’s broader structure remains intact. Prolonged consolidation at macro support often precedes volatility expansion, particularly when supply pressure dries up after extended drawdowns.
What Could Come Next for Litecoin (LTC)?
If the fractal comparison continues to play out, Litecoin may be approaching the later stages of its base formation.
Monero’s breakout followed:
For Litecoin, a similar roadmap would imply that the current consolidation phase could be a prelude to an upside rally, rather than a sign of weakness. The upper long-term trendline—currently far above price—stands out as the next major technical magnet if bullish momentum returns.
That said, structural support around $75 remains critical. Losing this level would weaken the fractal comparison and delay any bullish scenario.
Bottom Line
Despite recent downside pressure, Litecoin’s higher-timeframe structure suggests the correction may be part of a broader accumulation phase. The strong fractal similarity with Monero’s bullish path indicates that LTC could be lagging rather than weakening. As long as the $75 macro support holds, Litecoin may be positioning itself for a potential breakout in the coming cycle.
Frequently Asked Questions (FAQ)
Is Litecoin following Monero’s bullish price pattern?
Yes, Litecoin’s weekly and monthly charts show a strong fractal similarity to Monero, including shared cycle highs in 2017 and 2021 and a macro higher low formed after the 2022 bear market.
Why is the $75 level important for Litecoin?
The $75 region aligns with Litecoin’s long-term rising support trendline. Holding this level keeps the bullish higher-timeframe structure intact.
Disclaimer: The views and analysis presented in this article are for informational purposes only and reflect the author’s perspective, not financial advice. Technical patterns and indicators discussed are subject to market volatility and may or may not yield the anticipated results. Investors are advised to exercise caution, conduct independent research, and make decisions aligned with their individual risk tolerance.
About Author: Nilesh Hembade is the Founder and Lead Author of Coinsprobe, with over 5 years of experience in the cryptocurrency and blockchain industry. Since launching Coinsprobe in 2023, he has been providing daily, research-driven insights through in-depth market analysis, on-chain data, and technical research.
Disclaimer: The information on this page may come from third parties and does not represent the views or opinions of Gate. The content displayed on this page is for reference only and does not constitute any financial, investment, or legal advice. Gate does not guarantee the accuracy or completeness of the information and shall not be liable for any losses arising from the use of this information. Virtual asset investments carry high risks and are subject to significant price volatility. You may lose all of your invested principal. Please fully understand the relevant risks and make prudent decisions based on your own financial situation and risk tolerance. For details, please refer to
Disclaimer.
Related Articles
Ethereum Liquid Supply Hits 2024 Low on Binance
Abstract: CryptoQuant reports a notable contraction in Ethereum's liquid supply on Binance, with liquid ETH dropping to about 534,000 from a total reserve of 3.44 million. The trend, termed liquidity dryup, could reduce near-term selling pressure and provide price support if demand improves.
Summary: CryptoQuant notes Binance's ETH liquid supply fell to ~534k of 3.44M total, signaling a liquidity dryup that could ease selling pressure and support prices if demand strengthens.
CryptoFrontier59m ago
$78,000 BTC Price Support Level Reclaimed, Bitcoin Could Be Entering Bullish Reversal Stage
Bitcoin reclaiming $78k fuels a bullish reversal narrative and potential altseason, with bulls eyeing new ATHs up to $126k–$140k while bears warn of a fake pump before a cycle bottom.
Abstract: The article discusses Bitcoin reclaiming the $78,000 level as a potential bullish reversal that could spur altcoin rallies, outlining bullish and bearish forecasts, possible new ATHs, and rising market optimism.
CryptoNewsLand1h ago
Altcoin Trading Volume Share Hits Two-Month High at 51% on Major CEX
Gate News message, April 22 — According to analyst Darkfost, altcoin trading volume share on a major centralized exchange reached 51%, up significantly from 31% in early March, while Bitcoin and Ethereum shares fell to 30% and 17% respectively.
Ethereum's trading volume share declined sharply from
GateNews1h ago
Bitcoin Breaks Through $78,000, Ethereum Hits $2,390: Market Panic Eases
Bitcoin breaks through $78,000, while Ethereum climbs above $2,390. This article reviews the V-shaped reversal trend from April 13 to 22, analyzing the evolution of liquidation data and the Fear and Greed Index.
GateInstantTrends2h ago
SHIB Struggles to Recover as Fresh Developments Fail to Lift Price Action
SHIB trading activity rises, but price stays trapped in a tight consolidation range.
Whale accumulation increases while some long-term holders, including Aoki, exit positions.
Strong derivatives volume and inflows fail
CryptoNewsLand4h ago
Macro Recovery Drives Risk Asset Inflows; Crypto Market Shows Divergence Between Mainstream and Altcoins
Global risk appetite rose on easing Middle East tensions, lower energy prices, and strong institutional support, pushing equities to new highs; gold held gains while crypto and ETFs posted modest moves.
Global risk sentiment improved as tensions eased and energy prices fell, with equities at highs, gold firm, and crypto modestly higher; regulatory steps included France backing euro stablecoins and Circle's USDC Bridge.
GateNews5h ago