![]() Trusted Editorial content, reviewed by leading industry experts and seasoned editors. Ad Disclosure
On-chain data shows the Bitcoin Sell-Side Risk Ratio has plummeted recently. Here’s what this could suggest for the cryptocurrency.
Trusted Editorial content, reviewed by leading industry experts and seasoned editors. Ad Disclosure
On-chain data shows the Bitcoin Sell-Side Risk Ratio has plummeted recently. Here’s what this could suggest for the cryptocurrency.
Bitcoin Sell-Side Risk Ratio Has Fallen To Multi-Year Lows
In a new post on X, Glassnode analyst Chris Beamish has talked about the latest trend in the Bitcoin Sell-Side Risk Ratio, an on-chain indicator that keeps track of the ratio between the sum of all profits and losses realized on the network and the cryptocurrency’s Realized Cap.
Related Reading: Bitcoin On-Chain Alert: 2021 Cycle Coins Just MovedThe Realized Cap here refers to a capitalization model that calculates BTC’s total value by assuming that the value of each coin in circulation is equal to the price at which it was last transacted on the blockchain.
The last transfer price of any token is likely to represent its cost basis, so the Realized Cap measures the sum of the cost bases of the total BTC supply. In other words, it represents the total amount of capital that the investors have put into the cryptocurrency.
As such, the Sell-Side Risk Ratio tells us about how the amount of profit and loss that Bitcoin investors are realizing compares against the total capital stored in the asset.
Now, here is the chart for the indicator shared by Beamish that shows how its value has changed over the last few years:
![Bitcoin Sell-Side Ratio]()
The value of the metric seems to have plummeted in recent weeks | Source: @ChrisBeamish_ on X
As displayed in the above graph, the Bitcoin Sell-Side Risk Ratio shot up to a notable value with the price crash in November. This suggests that investors took a large amount of profit and loss alongside the volatility.
Since this high, the indicator’s value has seen a steep drop and has returned to the lowest level since October 2023. The analyst has noted that this points to “subdued conviction behind distribution at current price levels.”
Related Reading: Strategy Drops $1.25 Billion On Bitcoin Above $91,000Typically, market volatility tends to be low when these conditions form, so it only remains to be seen how the price of the cryptocurrency will develop in the near future.
In some other news, demand from the Bitcoin retail investors has been missing recently, as CryptoQuant author IT Tech has pointed out in an X post. The indicator cited by IT Tech is the 30-day change in the Retail Investor Demand, measuring the percentage change in the volume associated with the small hands (transactions valued at less than $10,000).
![Bitcoin Retail Demand]()
Looks like the value of the indicator has been negative recently | Source: @IT_Tech_PL on X
As is visible in the chart, the 30-day change in the Bitcoin Retail Investor Demand has been declining inside the negative zone recently, implying that the activity of the retail entities has been going down. The indicator’s trend hasn’t changed even after the recent recovery surge.
BTC Price
At the time of writing, Bitcoin is trading around $94,300, up more than 3% over the last 24 hours.
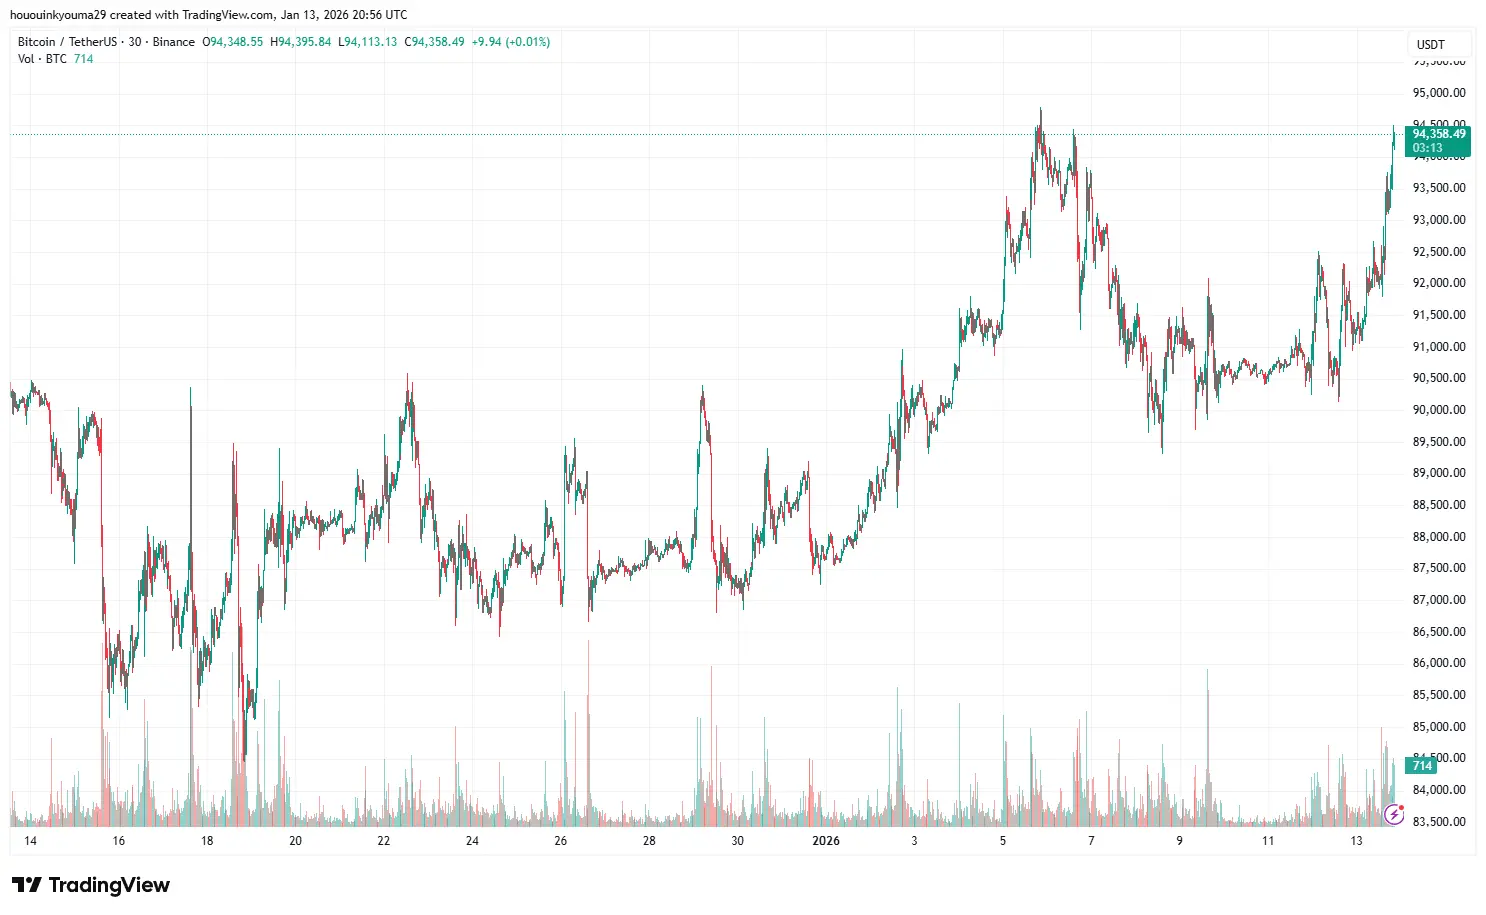
The trend in the price of the coin over the last month | Source: BTCUSDT on TradingView
Featured image from Dall-E, chart from TradingView.com
![]() Editorial Process for bitcoinist is centered on delivering thoroughly researched, accurate, and unbiased content. We uphold strict sourcing standards, and each page undergoes diligent review by our team of top technology experts and seasoned editors. This process ensures the integrity, relevance, and value of our content for our readers.
Editorial Process for bitcoinist is centered on delivering thoroughly researched, accurate, and unbiased content. We uphold strict sourcing standards, and each page undergoes diligent review by our team of top technology experts and seasoned editors. This process ensures the integrity, relevance, and value of our content for our readers.
Disclaimer: The information on this page may come from third parties and does not represent the views or opinions of Gate. The content displayed on this page is for reference only and does not constitute any financial, investment, or legal advice. Gate does not guarantee the accuracy or completeness of the information and shall not be liable for any losses arising from the use of this information. Virtual asset investments carry high risks and are subject to significant price volatility. You may lose all of your invested principal. Please fully understand the relevant risks and make prudent decisions based on your own financial situation and risk tolerance. For details, please refer to
Disclaimer.
Related Articles
Robert Kiyosaki warns of the risk of market collapse, prioritizing Bitcoin and real assets.
Robert Kiyosaki advocates for long-term investment in non-inflatable assets like oil, real estate, and cryptocurrencies amid market downturn concerns. He focuses on accumulating tangible assets, aiming to prosper during economic crises, and has recently resumed buying before a predicted market collapse in 2026.
TapChiBitcoin36m ago
HUT 8 builds a flexible data center for AI and Bitcoin
Hut 8 is implementing a modular infrastructure strategy to flexibly switch between Bitcoin mining and AI tasks, optimizing capital efficiency amidst data center expansion. This approach enhances profitability and mitigates dependence on volatile crypto markets, despite increasing operational complexity.
TapChiBitcoin45m ago
Glassnode: The accumulation structure for Bitcoin between $60,000 and $70,000 is taking shape, but the strength is far less than the previous highs.
According to Glassnode's report, the cost basis for short-term Bitcoin holders is at the lower range of $60,000-$70,000, indicating accumulation signals, but the strength is still insufficient. BTC has accumulated over 429,000 in this range, and this area is considered a high-confidence support zone. The options market indicates that short-term volatility may intensify.
動區BlockTempo49m ago
USD/JPY Hits 160 Again – Is a Bitcoin Crash Coming Next?
_USD/JPY crosses 160 for the first time since July 2024, raising attention from global investors._
_July 2024 BOJ intervention dropped USD/JPY 20 points, Bitcoin 30%, and S&P 500 10%._
_Strengthening yen raises borrowing costs for leveraged investors, affecting stocks and crypto
LiveBTCNews1h ago
The cryptocurrency fear index has dropped to 9, with the market continuing to maintain "extreme fear."
The current cryptocurrency market fear and greed index has dropped to 9, indicating extreme fear in the market, well below yesterday's 12 and last month's average of 13. This index consolidates multiple indicators to assess market sentiment.
BlockBeatNews2h ago
