
Cardano is kicking off 2026 with some renewed energy, and the chart is making one thing very clear. ADA is right back at the level that’s been holding it down for weeks.
As Sssebi put it, ADA “wants to fly” as it presses into the $0.40 zone, and that’s not hype, it’s just what the ADA chart is showing.
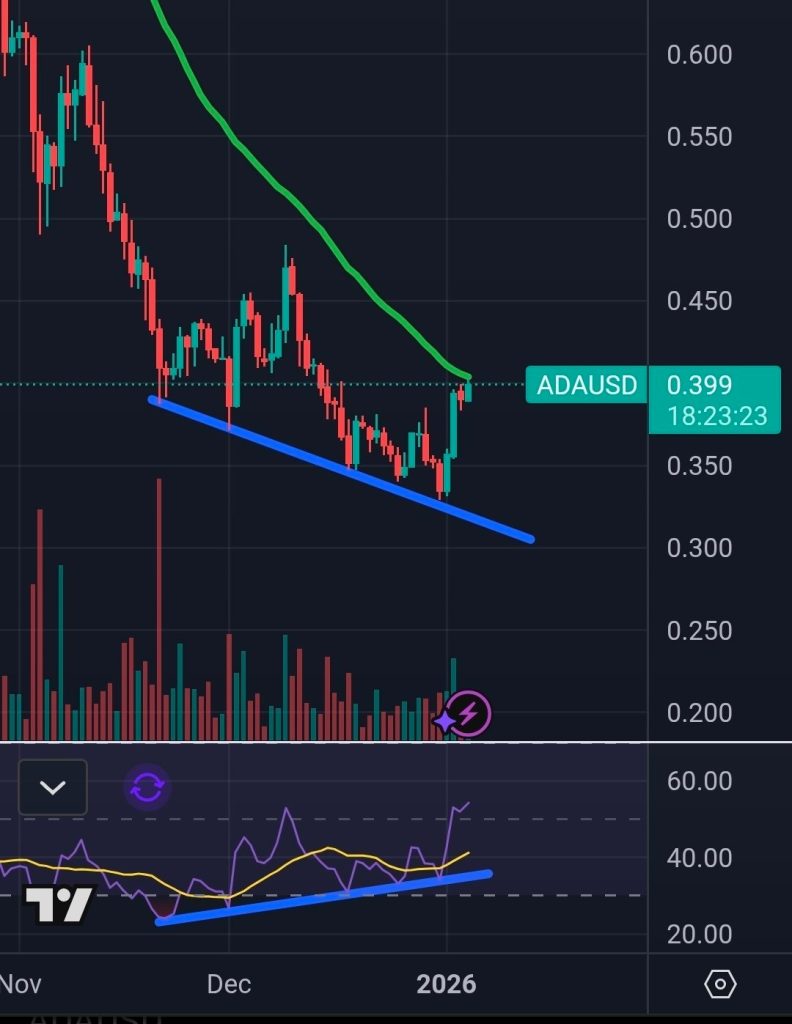
The ADA price is hovering around the area of $0.399 following the remarkable recovery. Now, it seems like the market is reaching a crossroads in terms of what might happen next.
- What the ADA Chart Is Really Saying
- RSI Is Helping the Bullish Case, But Proof Still Matters
- What’s Next for ADA?
What the ADA Chart Is Really Saying
The first thing that stands out is the pressure from above. That downward-sloping green line has acted as a lid on price, stopping multiple rally attempts. Right now, ADA is testing that trendline at the same time it’s testing horizontal resistance near $0.40, which makes this area especially important.
Source: X/@Sssebi
Below the price, the blue trendline tells another part of the story. The ADA price kept making lower lows during the pullback, but that support line held firm. When the price bounced, it did so quickly, which usually signals that sellers were running out of steam near the lows.
This is the kind of setup where the market compresses, finds a floor, and then sends price straight back into resistance to see who’s really in control.
AI Ranks LINK and SOL as Top 2026 Bets, Flags ADA as a Risk_**
RSI Is Helping the Bullish Case, But Proof Still Matters
Momentum indicators are starting to lean in favor of the bulls. On the RSI, the price was drifting lower into late December, but RSI was quietly making higher lows.
That bullish divergence often shows up when selling pressure is fading, even if the price hasn’t flipped direction yet.
Now RSI is rising along with price, which supports the idea that this bounce has some substance. Still, divergence alone isn’t enough. ADA needs to actually break and hold resistance to turn momentum into a trend.
What’s Next for ADA?
Everything revolves around $0.40. A bright breakout past that point and a hold would be a strong move. The levels to watch after that would be around the $0.45 mark, with the large psychological level at $0.50 following.
As long as 0.40 acts as a resistance level, attention turns once again to support. The first area to watch is around $0.37, followed by $0.35. Below that, the low $0.30s remain the deeper support zone that buyers don’t want to see tested again.
For now, the ADA price is doing what it needs to do. The bounce looks strong, RSI supports the move, and the price is pressing into the exact level that can change the tone of the chart.
What happens around $0.40 over the next few candles should tell the story of whether this move has real legs or needs more time to develop.
Disclaimer: The information on this page may come from third parties and does not represent the views or opinions of Gate. The content displayed on this page is for reference only and does not constitute any financial, investment, or legal advice. Gate does not guarantee the accuracy or completeness of the information and shall not be liable for any losses arising from the use of this information. Virtual asset investments carry high risks and are subject to significant price volatility. You may lose all of your invested principal. Please fully understand the relevant risks and make prudent decisions based on your own financial situation and risk tolerance. For details, please refer to
Disclaimer.
Related Articles
XRP Ledger reaches 120 TPS, activity surges but the price remains "stagnant."
The XRP ledger is experiencing unusual activity, processing 600-700 transactions per block and over 120 transactions per second without increasing fees. This surge is mainly due to decentralized exchange (DEX) activities, particularly mass order cancellations. Despite the increase in on-chain activity, XRP's price has not reacted, indicating a disconnect between network activity and market response.
TapChiBitcoin21m ago
Today’s Crypto Fear and Greed Index has fallen to 9, and the market is in extreme fear.
Gate News message, March 29, according to data from Alternative.me, today the Crypto Fear & Greed Index has fallen to 9, down further from yesterday’s 12, and the market is still in an “extreme fear” state.
GateNews1h ago
Bittensor (TAO) Hits a 3-Month Peak: What Caused the Rally and What Comes Next?
Many leading cryptocurrencies have posted slight declines or negligible increases over the past 24 hours, but this isn’t the case for Bittensor (TAO), whose price soared by 15%.
The question now is whether this momentum can hold or if a pullback is coming next.
Further Gains
CryptoPotato2h ago
ETH falls 0.85% in 15 minutes: Exchange outflows and ETF trimming in sync amplify volatility
From 23:00 to 23:15 (UTC) on March 28, 2026, the price of ETH fluctuated downward within the range of 1,989.32 to 2,012.0 USDT, recording a return of -0.85%, with a volatility of 1.13%. During this period, market attention increased, and short-term fluctuations intensified, prompting traders to closely monitor the performance of key support zones.
The main driver of this volatility is the continuous outflow of ETH from major exchanges to on-chain wallets since March, with a total outflow of 31.6 million coins, leading to a contraction in exchange liquidity and causing prices to be sensitive to large orders. Meanwhile,
GateNews2h ago
Is the XRP Bottom Finally Here? 3 Massive Bullish Signals You Need to See
Although in a more modest manner, XRP whales have returned to the scene, amassing more tokens over the past week, which is categorized as the first bullish sign for the underlying asset.
Another could come in the form of the technical tool used to determine whether that asset’s move in either
CryptoPotato3h ago
