
Date: Fri, Dec 26, 2025 | 06:30 PM GMT
The broader cryptocurrency market has been navigating a period of choppy and uncertain price action over the past several weeks, a phase that began after the sharp market-wide sell-off on October 10. During that correction, Ethereum (ETH) dropped nearly 28% over the last 60 days, applying sustained pressure across the altcoin sector — including ether.fi (ETHFI).
ETHFI has mirrored this weakness, sliding more than 31% over the same period. However, despite the sharp downtrend, recent price behavior suggests selling pressure may be easing. The token is now trading near a historically significant demand zone, where buyers have repeatedly stepped in before — raising the possibility that ETHFI could be approaching an inflection point.
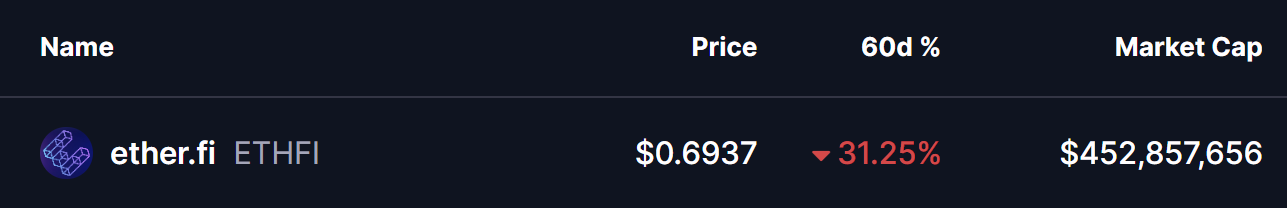
Source: Coinmarketcap
Double Bottom Pattern in Focus
On the daily timeframe, ETHFI appears to be forming a potential double-bottom structure — a classic reversal pattern that often signals exhaustion among sellers. The setup began after ETHFI was rejected from the $0.9233 resistance area, a move that triggered a sharp decline of nearly 28% and pushed price back toward the lower end of its range.
That sell-off dragged ETHFI into the $0.65 support zone, a level that has consistently acted as a strong demand area in the past. The chart now shows price revisiting this same region and stabilizing once again, suggesting buyers are actively defending it. The similarity between the first and second lows strengthens the case that a double-bottom base may be forming.
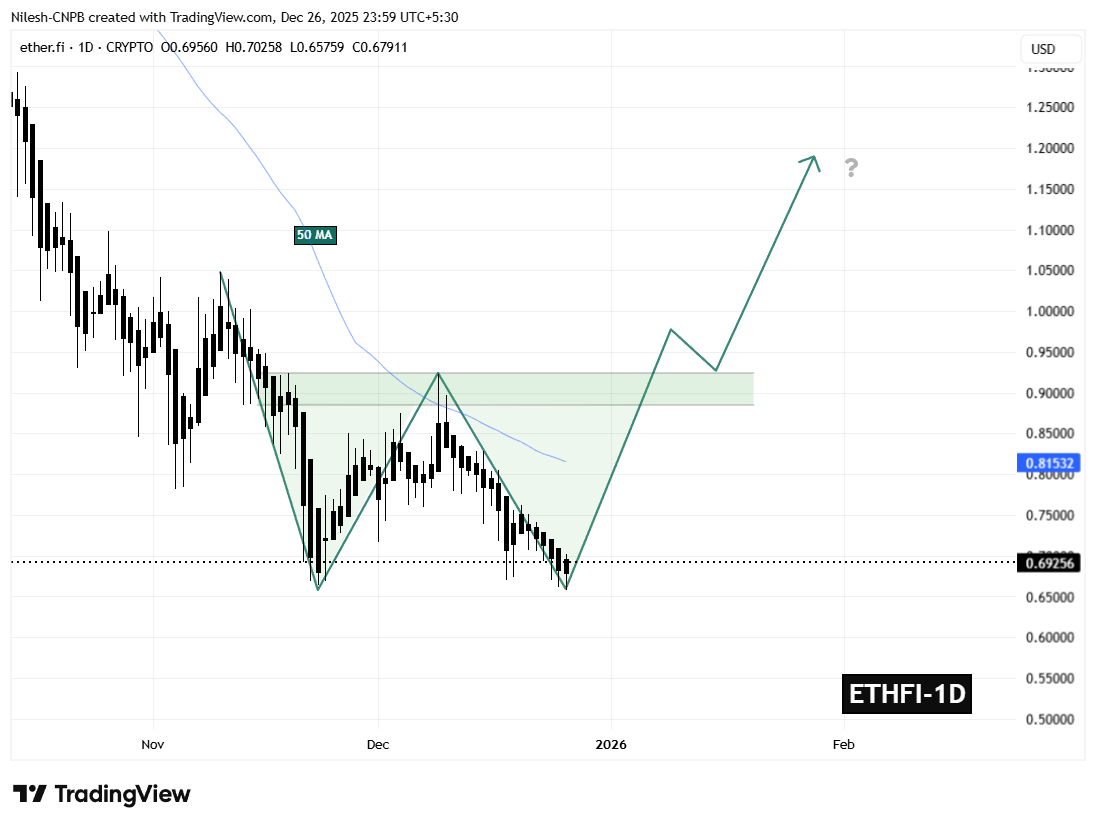
ETHFI Daily Chart/Coinsprobe (Source: Tradingview)
If this support continues to hold, the ongoing consolidation could mark the completion of the second bottom — a critical step in shifting momentum away from sellers and toward a potential trend reversal.
What’s Next for ETHFI?
The $0.65 support zone remains the most important level to monitor in the near term. As long as ETHFI holds above this area, the developing bullish structure remains valid and provides room for momentum to gradually rebuild.
On the upside, the first major challenge sits at the 50-day moving average near $0.8153. This level has repeatedly capped recovery attempts throughout the recent downtrend and now represents the initial test for buyers. A sustained move above this moving average would signal improving market structure and growing bullish confidence.
Beyond that, the $0.9233 neckline stands as the key confirmation level. A decisive breakout above this resistance would complete the double-bottom pattern and significantly strengthen the bullish outlook, potentially opening the door for a broader recovery move in the weeks ahead.
For now, ETHFI finds itself at a technically pivotal zone — one that could either reinforce the existing downtrend or mark the beginning of a meaningful rebound if buyers continue to defend support.
Disclaimer: The views and analysis presented in this article are for informational purposes only and reflect the author’s perspective, not financial advice. Technical patterns and indicators discussed are subject to market volatility and may or may not yield the anticipated results. Investors are advised to exercise caution, conduct independent research, and make decisions aligned with their individual risk tolerance.
Disclaimer: The information on this page may come from third parties and does not represent the views or opinions of Gate. The content displayed on this page is for reference only and does not constitute any financial, investment, or legal advice. Gate does not guarantee the accuracy or completeness of the information and shall not be liable for any losses arising from the use of this information. Virtual asset investments carry high risks and are subject to significant price volatility. You may lose all of your invested principal. Please fully understand the relevant risks and make prudent decisions based on your own financial situation and risk tolerance. For details, please refer to
Disclaimer.
Related Articles
Robert Kiyosaki recommends Bitcoin, gold as 1974 shift comes full circle
Rich Dad Poor Dad author Robert Kiyosaki has argued that the economic shifts set in motion more than five decades ago are now unfolding, advocating for Bitcoin and gold while warning against rising debt, inflation and retirement risks.
In a Saturday post on X, Kiyosaki pointed to 1974 as a
Cointelegraph53m ago
DOGE Defends Key Support While On-Chain Activity Increases
DOGE active addresses jumped 28% in one week, showing growing network engagement.
Price holds critical levels near $0.0912–$0.0928 despite minor dips.
Breaking above $0.0930 could target $0.0950, $0.0980, and potentially $0.10.
Dogecoin — DOGE, has shown interesting movements this week,
CryptoNewsLand2h ago
Is Bitcoin mispricing a prolonged Iran war? Ex-hedge fund manager weighs in
James Lavish warns Bitcoin holders that continued conflict in Iran could trigger inflation and market downturns. While Bitcoin may face further declines, he sees potential long-term opportunities. He discusses the impact of global economic pressures on investments.
Cointelegraph2h ago
10x Research: Tether’s USDT issuance on Ethereum surpasses Tron—ETH could become the main beneficiary of stablecoin growth
10x Research noted that over the past five years, Ethereum (ETH) has performed lackluster, with its price trading around $2,000, mainly due to weak on-chain activity leading to insufficient demand. After falling 57% from its 2025 peak, ETH’s current valuation remains low, while capital accumulation is still ongoing; USDT’s issuance has surpassed Tron, sparking discussion that ETH could become a leading beneficiary of stablecoin growth. Analysts are now re-evaluating ETH’s potential turning point.
GateNews2h ago
Bitcoin Holds Steady Near $67K Amid Bullish and Geopolitical Tension
This weekend, Bitcoin ($BTC) has shown a steady performance in line with a blend of technical and geopolitical outlook. In this respect, Bitcoin ($BTC) is changing hands at $67K with significant support levels at $64K and $65K and notable resistance at $74K. As per the data from CRYPTO Damus, the
BlockChainReporter2h ago
XRP Trading Volume Drops by 50% as the Altcoin Records Six Consecutive Red Monthly Closes
XRP trading volume drops by 50%, feeding bearish expectations.
The altcoin records six consecutive red monthly closes.
Could this be the longest coil for XRP before the biggest launch?
The crypto community is disheartened to see the
CryptoNewsLand5h ago
