
Date: Tue, Dec 23, 2025 | 06:01 PM GMT
The broader cryptocurrency market has remained under pressure over the past several weeks, with the ongoing corrective phase weighing heavily on overall altcoin sentiment. Monad (MON) has also felt the impact of this weakness, as persistent selling pressure has kept price action subdued and volatile.
MON has declined by nearly 32% over the past 30 days, yet a closer look at the chart suggests that the current structure may be more constructive than it appears at first glance. Interestingly, Monad’s recent price behavior is beginning to resemble a bottoming pattern that previously played out on Hyperliquid (HYPE), a setup that eventually led to a powerful upside reversal earlier this year.
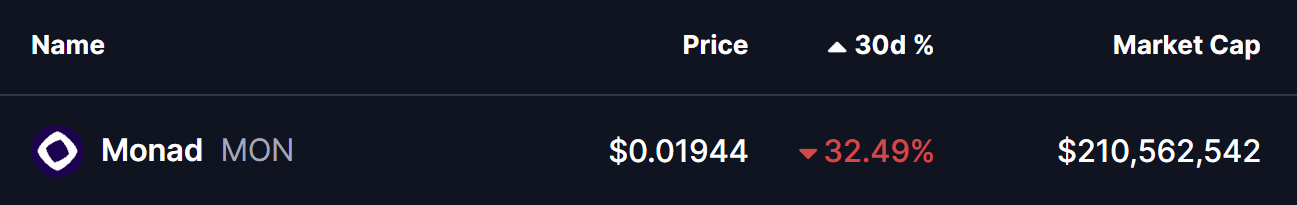
Source: Coinmarketcap
MON Mirrors HYPE’s Fractal Structure
On the comparative charts, MON appears to be tracing a structure strikingly similar to HYPE’s April 2025 fractal. In HYPE’s case, the token endured a deep 73% correction from its all-time high before forming a broadening wedge structure near the bottom. That consolidation phase ultimately resolved to the upside, with price reclaiming its key moving average and triggering a rally of more than 160% in the weeks that followed.
Monad’s decline from its own all-time high has reached roughly 65%, placing it well within the range of historical washout zones often associated with trend exhaustion. The current setup shows MON compressing within a symmetrical broadening wedge, a pattern that frequently precedes strong directional moves once price escapes the structure.
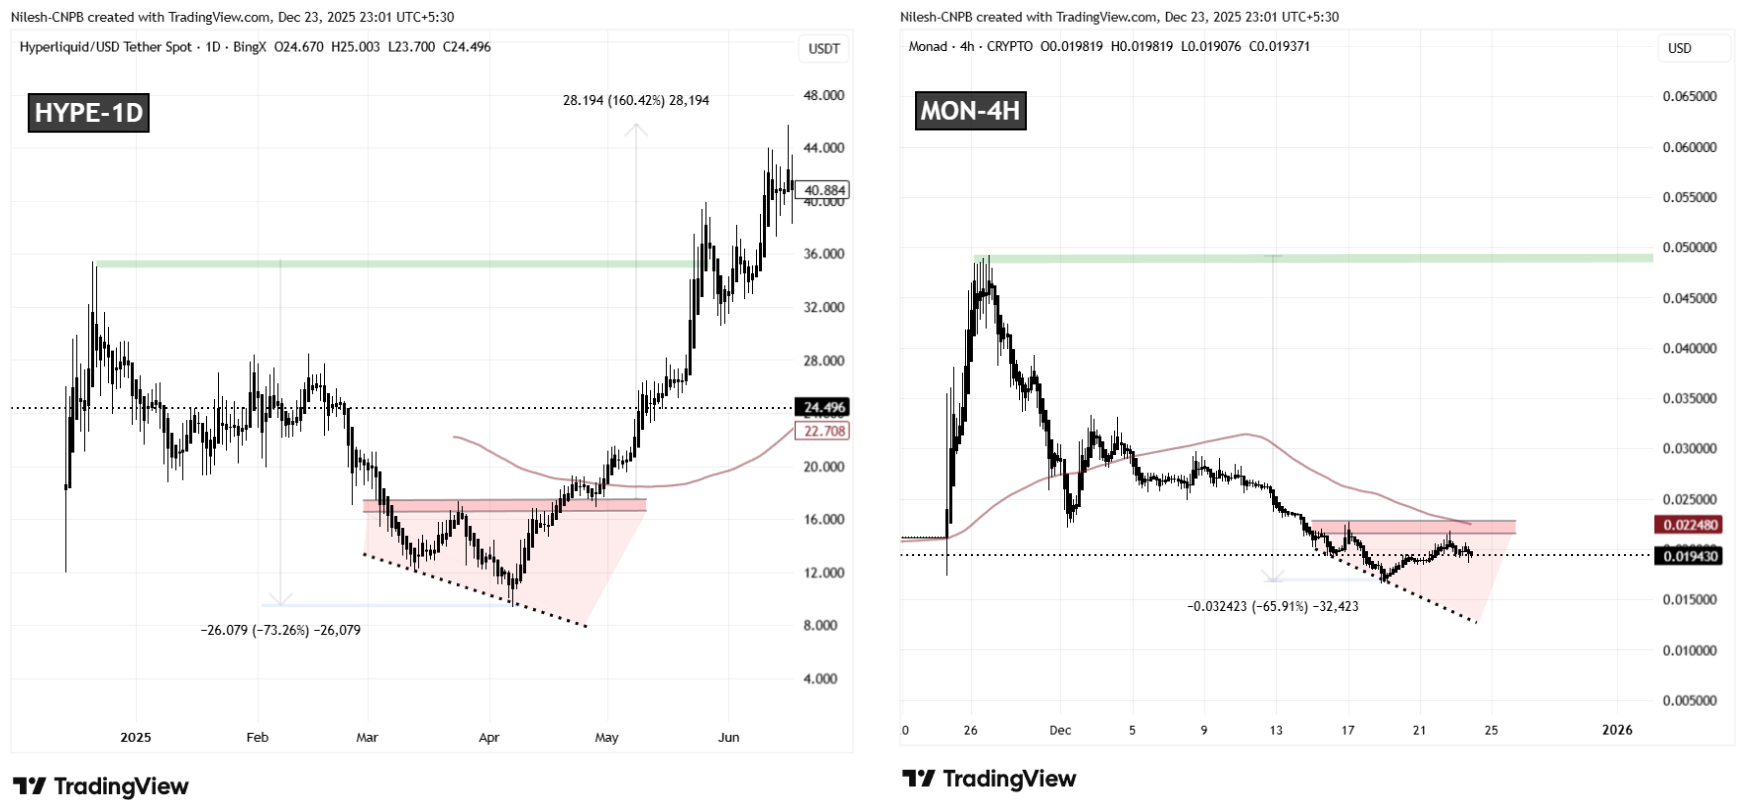
HYPE and MON Fractal Chart/Coinsprobe (Source: Tradingview)
This similarity becomes more compelling when viewed alongside the price behavior around resistance. MON is currently hovering just below a key neckline resistance band between $0.02170 and $0.02268, an area that closely mirrors the zone where HYPE consolidated before its breakout. The alignment between these two structures suggests that MON may be approaching a decision point.
What’s Next for MON?
Despite the growing resemblance to HYPE’s pre-breakout phase, the technical picture has not yet fully shifted in favor of the bulls. Sellers still retain short-term control, and confirmation is needed before a bullish reversal can be considered valid.
For momentum to flip decisively, MON would need to break above the upper boundary of the wedge and reclaim its 100 moving average, which sits near the $0.02248 level. A successful move above this region would signal improving trend strength and increase the probability that the fractal analogy continues to play out.
If such a breakout occurs, the upside potential becomes notable. A sustained bullish reversal could open the door for a broader recovery move toward the $0.049 area, which aligns with MON’s previous all-time high and represents roughly 155% upside from current levels. Until then, price action around resistance will remain critical in determining whether this fractal setup evolves into a full-fledged trend reversal or fails under continued market pressure.
**Disclaimer: **The views and analysis presented in this article are for informational purposes only and reflect the author’s perspective, not financial advice. Technical patterns and indicators discussed are subject to market volatility and may or may not yield the anticipated results. Investors are advised to exercise caution, conduct independent research, and make decisions aligned with their individual risk tolerance.
Disclaimer: The information on this page may come from third parties and does not represent the views or opinions of Gate. The content displayed on this page is for reference only and does not constitute any financial, investment, or legal advice. Gate does not guarantee the accuracy or completeness of the information and shall not be liable for any losses arising from the use of this information. Virtual asset investments carry high risks and are subject to significant price volatility. You may lose all of your invested principal. Please fully understand the relevant risks and make prudent decisions based on your own financial situation and risk tolerance. For details, please refer to
Disclaimer.
Related Articles
BTC up 0.58% in 15 minutes: exchange net outflows and ETF buy orders converge to lift the price
Between 2026-04-17 08:45 and 2026-04-17 09:00 (UTC), the BTC price surged in the short term. The candlestick return was +0.58%, with a price range of 75265.0 - 75862.3 USDT and a range of 0.79%. Market volatility increased and attention rose, with trading volume significantly higher than usual, reflecting a convergence between capital flow and technical signals.
The main driver behind this unusual move is the exchange’s net outflow of BTC in sync with ETF capital inflows. Data shows that within the past 24 hours, exchanges recorded a net outflow of 2,844.68 BTC
GateNews30m ago
Citi Study: Bitcoin and Gold Together Outperform Single Asset Allocation in Long-Term Portfolios
A Citi study recommends combining Bitcoin and gold in investment portfolios for improved long-term returns, noting better performance in various market conditions. Wells Fargo predicts gold could rise to $8,000 by 2027, driven by central bank concerns. Meanwhile, Bitcoin funding rates have reached lows, historically marking turning points.
GateNews30m ago
ETF Launch Fails to Stem Tide As XRP Sinks to $1.81, Lowest Since April
Crypto asset manager Bitwise’s launch of a spot XRP exchange-traded fund on Nov. 20 failed to lift the token, which fell to $1.81 — its weakest level since April — before a broader Nov. 21 sell‑off drove monthly losses above 20%.
ETF Launch Followed by Double-Digit Losses
The highly
Coinpedia37m ago
PENGU’S at a Crossroad: $0.008 Supply Zone Signals Major Move Ahead
PENGU shows steady accumulation with strong whale participation and controlled upward momentum.
Spot and futures markets align, supporting a broader and healthier uptrend.
$0.008 supply zone acts as key resistance defining the next major price move.
Pudgy Penguins entered a decisive mome
CryptoNewsLand51m ago
Bitcoin Composite Market Index (BCMI) Approaches High-Conviction Support Zone, Signals Value Accumulation Phase
Bitcoin's Composite Market Index is testing a crucial pivot level, indicating BTC is historically undervalued. Key metrics like MVRV and NUPL show reset investor sentiment, while a downtrend in the 90-day SMA suggests ongoing selling pressure.
GateNews2h ago
