Date: Sat, Dec 27, 2025 | 10:25 AM GMT
Dash (DASH), the privacy-focused token, has struggled alongside the broader altcoin market over the past month, shedding nearly 35% of its value amid persistent selling pressure. However, price action is now starting to stabilize, with DASH trading in the green today and posting a modest 4% recovery. More importantly, the latest chart structure suggests that the recent rebound may not be just a short-lived bounce, but part of a developing bullish setup.
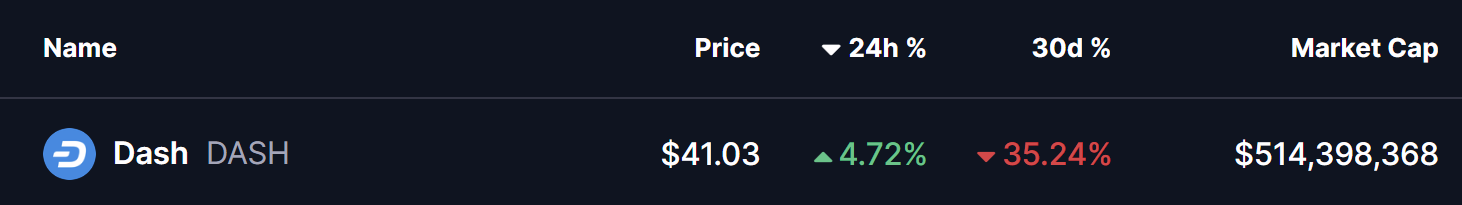
Source: Coinmarketcap
Harmonic Pattern Hints at Potential Upside
On the 4-hour timeframe, DASH is forming a Bearish Butterfly harmonic pattern. While the name may sound negative, this pattern typically allows for a strong upside move during its CD leg before price reaches the final reversal zone.
The structure began at Point X near $42.64, followed by a sharp decline into Point A. From there, DASH rebounded toward Point B, where sellers briefly reasserted control, before price dipped once again into Point C around $36.17. This region has since acted as a firm base, with buyers stepping in aggressively to defend the lows.
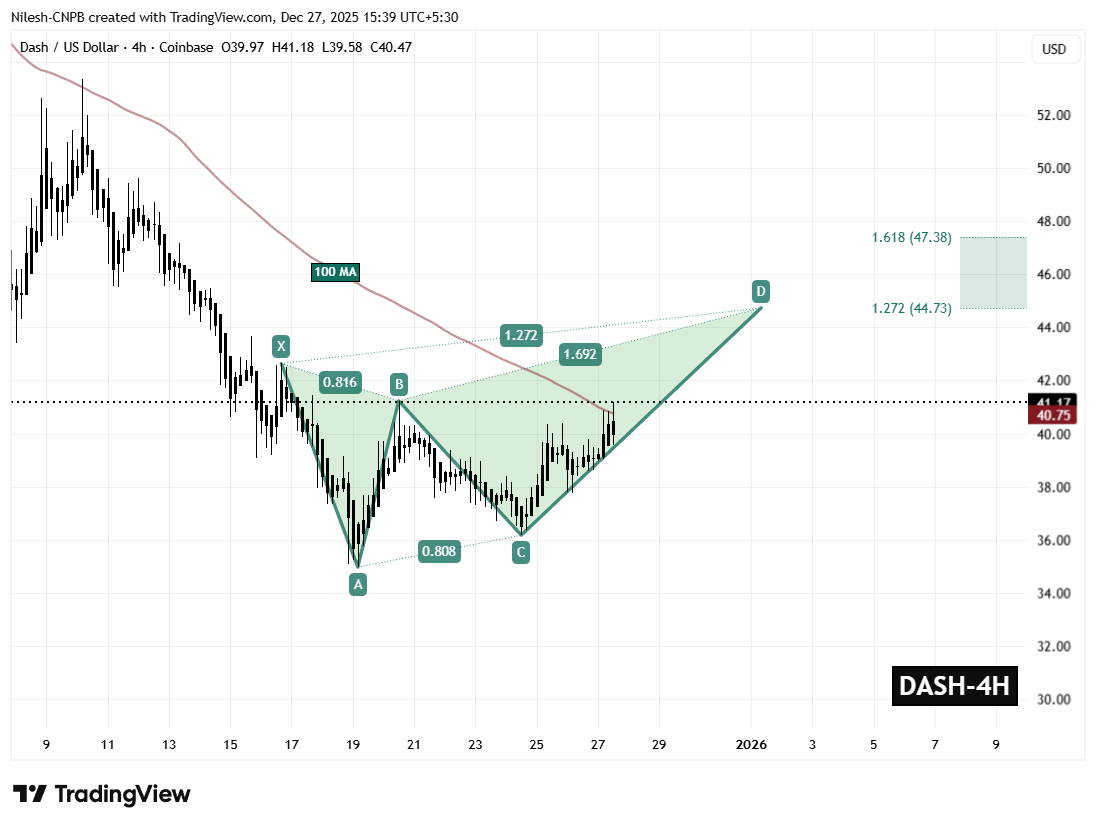
Dash (DASH) 4H Chart/Coinsprobe (Source: Tradingview)
From Point C, DASH has staged a steady recovery and is currently trading near $41.17. This move indicates improving momentum and suggests that the CD leg of the harmonic structure is actively unfolding.
Adding further strength to this setup is DASH’s successful reclaim of the 100-period moving average near $40.75. This level had previously acted as dynamic resistance throughout the downtrend, and flipping it into support marks a meaningful shift in short-term market structure.
What’s Next for DASH?
As long as DASH holds above the $39.58 support zone, the bullish harmonic structure remains intact. Continued strength above the 100 MA would likely reinforce buyer confidence and keep the CD leg in play.
If momentum persists, the Bearish Butterfly projection points toward the Potential Reversal Zone (PRZ) between $44.73 and $47.38. This area represents the typical completion zone for the pattern and offers an upside window of roughly 14% from current levels before sellers may attempt to regain control.
On the flip side, a breakdown below $39.58 would weaken the bullish outlook and risk invalidating the harmonic structure. Such a move could expose DASH to renewed downside pressure and delay any sustained recovery attempt.
For now, DASH’s ability to hold above reclaimed moving average support and continue building higher lows will be critical in determining whether this recovery can extend further in the sessions ahead.
Disclaimer: The views and analysis presented in this article are for informational purposes only and reflect the author’s perspective, not financial advice. Technical patterns and indicators discussed are subject to market volatility and may or may not yield the anticipated results. Investors are advised to exercise caution, conduct independent research, and make decisions aligned with their individual risk tolerance.
Disclaimer: The information on this page may come from third parties and does not represent the views or opinions of Gate. The content displayed on this page is for reference only and does not constitute any financial, investment, or legal advice. Gate does not guarantee the accuracy or completeness of the information and shall not be liable for any losses arising from the use of this information. Virtual asset investments carry high risks and are subject to significant price volatility. You may lose all of your invested principal. Please fully understand the relevant risks and make prudent decisions based on your own financial situation and risk tolerance. For details, please refer to
Disclaimer.
Related Articles
XRP Faces Selling Pressure While Key Support Near $1.28 Holds
Key Insights:
XRP continues forming lower highs and lows, while price remains below major moving averages, reinforcing a sustained bearish structure across timeframes.
Open interest spikes during volatility signaled speculative trading, yet declining levels now reflect reduced risk
CryptoNewsLand1h ago
SHIB Holds Weak Range as Burn Rate Drops and Pressure Builds
Key Insights
SHIB remains within a long-standing descending channel, with price stuck in the lower range and unable to break persistent resistance levels.
The burn rate dropped sharply, removing a short-term support factor and reducing retail-driven momentum seen earlier during increased
CryptoNewsLand2h ago
HYPE Price Break Signals Deeper Pullback Amid Weak Momentum
Key Insights:
HYPE broke below $37 support after repeated tests, signaling weakening buyer strength and confirming growing bearish control across short-term price structure movements.
Fibonacci levels identify $32.44 and $29.5 as critical demand zones, where buyers may re-enter as
CryptoNewsLand2h ago
Solana Price Faces Downside Risk as Bears Eye $74 Zone
Key Insights
Solana trades near eighty dollars as bearish momentum builds, with indicators signaling weakness and increasing probability of testing lower support levels soon.
Technical signals, including weak MACD and low RSI momentum, indicate sellers remain dominant, reinforcing downside p
CryptoNewsLand2h ago
Dogecoin Sees Rising Long Bets While Price Stays Under Pressure
Dogecoin's long positioning increases as traders expect a rebound, yet significant short positions and declining trading volume suppress price movement. The market lacks direction, showing a sideways to slightly bearish outlook as the price struggles to gain momentum.
CryptoNewsLand3h ago
Dogecoin Eyes Breakout as Bollinger Bands Signal Price Shift
Key Insights:
Dogecoin trades near resistance as Bollinger Bands tighten, signaling reduced volatility and an increasing likelihood of a sharp directional price movement soon.
Declining trading volume reflects market hesitation, yet reduced selling pressure may still support upward
CryptoNewsLand3h ago
