SPX6900 (SPX) – the meme coin drawing attention – has recorded an increase of nearly 2% at the time this article was published on Monday, following a strong bounce back of 4.71% in the previous trading session. The return of confidence from ‘whales’ is considered the main catalyst for this recovery, while also injecting a new wave of optimism into the SPX6900 derivatives market.
Whale activity drives the bounce back of SPX6900
According to analysis data from Santiment, the supply distribution of SPX6900 clearly reflects the movements of investor groups according to specific holding levels. In particular, the increase in the amount of tokens held by large-volume ownership groups – often referred to as “whales” – is a sign that they are gradually returning to the market. Conversely, when the holdings of this group decrease, selling pressure tends to increase.
Specifically, the whale group holding between 100 million to 1 billion SPX is currently stable at 147.57 million tokens - a slight decrease from last week’s 151.55 million. This trend indicates that the sell-off wave from the large investor group has slowed down, thereby helping to alleviate selling pressure in the market.
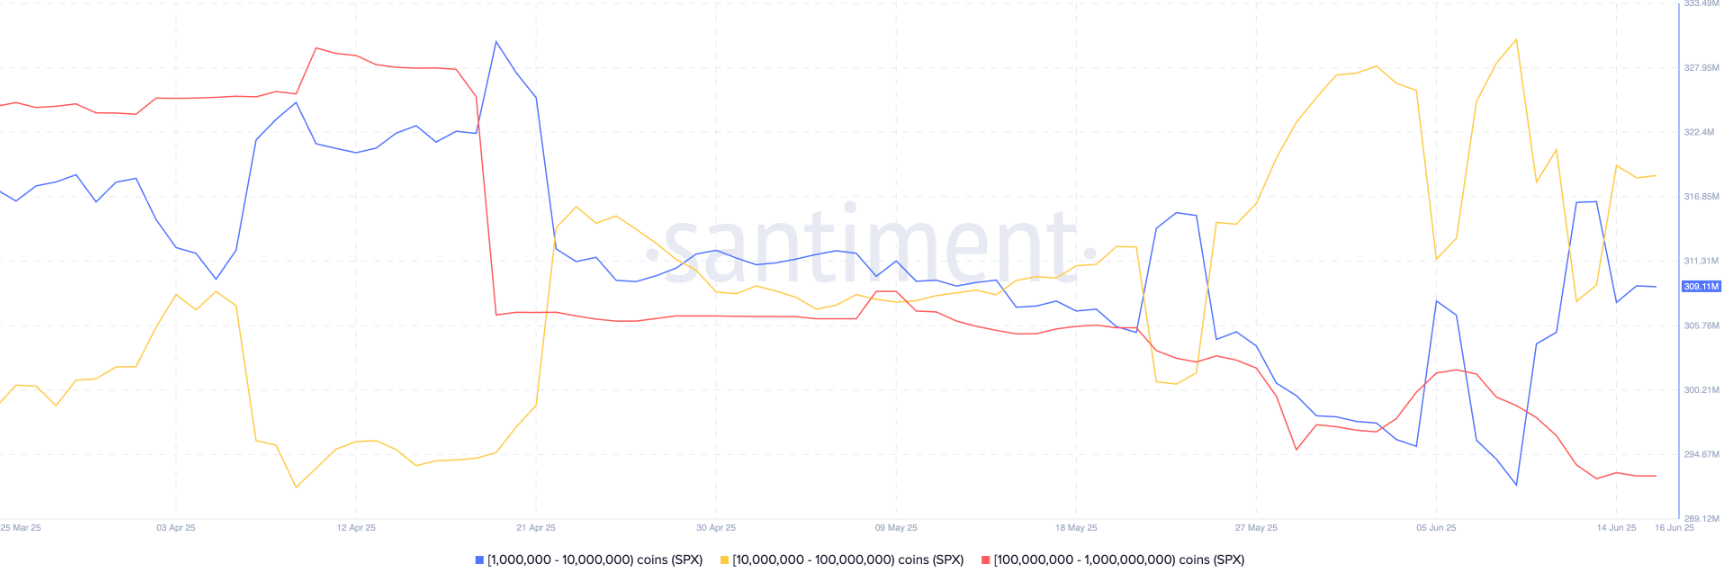 Distribution of SPX6900 Supply | Source: SantimentMeanwhile, the average investor group – holding from 10 million to 100 million SPX – has increased their total holdings to 253.9 million tokens, a significant increase from the 244.74 million just a few days ago. Similarly, the smaller group with holdings from 1 million to 10 million tokens has also increased their ownership to 309.11 million SPX, compared to 292.04 million from last week.
The selling pressure from large whales has stalled, combined with increased buying from smaller investor groups, creating a positive momentum for SPX6900. These signals reinforce expectations for a strong growth trend for this meme coin.
Positive signals spread in the SPX6900 derivative market
According to data from Coinglass, SPX’s (OI) open contract has soared by more than 7%, reaching $144.54 million. This figure clearly reflects the growing interest from traders as well as the strong flow of money into the market. With the SPX derivatives market cap on the rise, the new buying force could become the catalyst for a further SPX6900 bull run.
On the contrary, the recent short-term bounce back has caused significant losses for the bears: a total of 265,000 USD in Short positions were liquidated, while the bulls (Long) only lost 76,000 USD. This indicates that the pressure is leaning towards the sellers — a signal reinforcing the current upward momentum.
The Long/Short ratio, an index measuring the correlation between Long and Short positions, is an important tool for assessing market sentiment. When this ratio is greater than 1, the number of Long positions dominates; conversely, if it is less than 1, Short positions dominate.
In the past 24 hours, the Long/Short ratio of SPX recorded at 1.0182 – a slight increase but signifies that buying power is gradually overshadowing selling pressure.
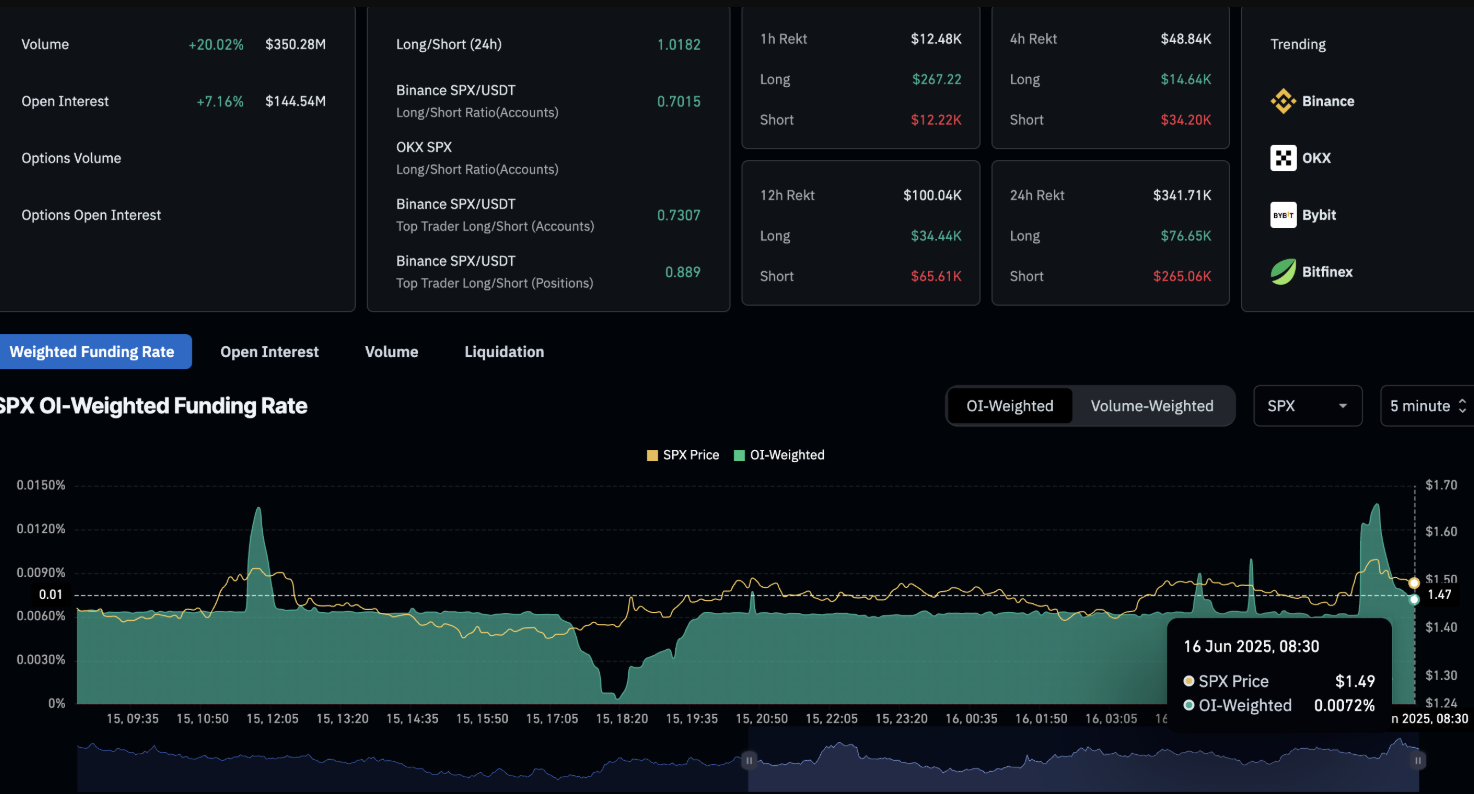 The derivative indices of SPX6900 | Source: Coinglass. Finally, the funding rate index is adjusted according to open contracts (OI-weighted funding rate) shows the fee that investors need to pay to maintain price balance between perpetual swap contracts and the spot market. In a bullish market context, bulls usually have to pay a fee to bears – and vice versa when the trend reverses.
As of now, this funding rate is at 0.0072%, clearly reflecting the dominance of the bulls. Although this figure has cooled somewhat from the previous peak of 0.0138% set earlier in the day, it still indicates that market sentiment is leaning towards growth.
SPX Price Forecast: The bounce back could aim for a new peak
After being rejected at $1.74 last week, SPX6900 recorded a slight decline, causing the weekly yield to shrink below 20%. However, this meme coin has maintained above the important technical threshold at $1.28, thereby affirming its position as one of the standout names in terms of performance in the current market cycle.
The strong bounce from the support area of $1.28 — coinciding with the Fibonacci level of 78.6% — has marked the end of the correction phase that originated from the highest closing in January at $1.55 to the lowest bottom in March at $0.29. This recovery momentum helps the price approach the key resistance zone at $1.55.
If SPX can close the daily candle above $1.55, the upward trend will be confirmed more firmly, opening up the opportunity to extend the bounce back towards the next target at the Fibonacci level 1.272 at $1.89.
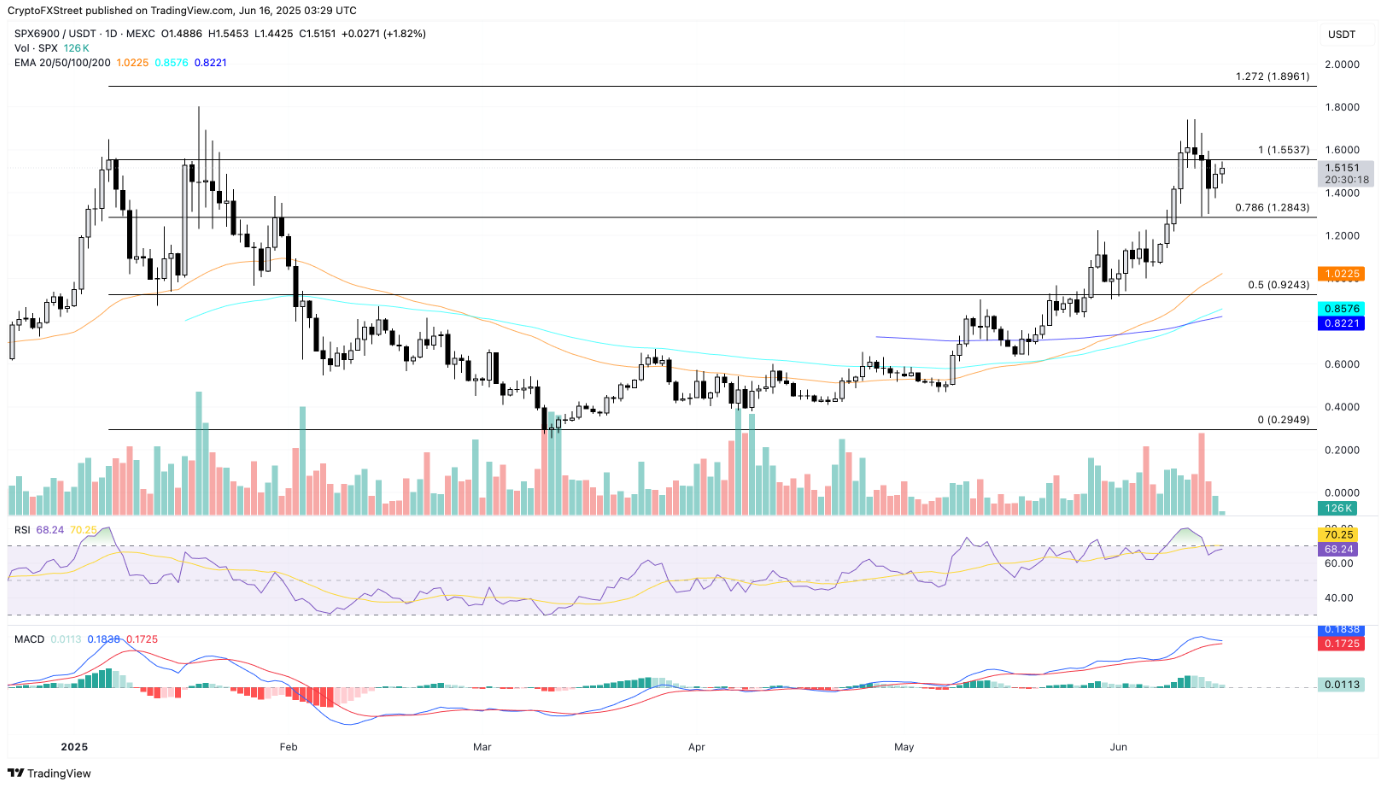 Daily SPX/USDT Chart | Source: TradingViewThe Relative Strength Index (RSI) is currently at 67 – close to the overbought threshold – indicating that the upward momentum remains stable. However, the MACD indicator is approaching the signal line, with the potential for a bearish crossover, warning of a possible adjustment risk. This suggests that momentum indicators are sending mixed signals, reflecting a tug-of-war in the short-term trend.
If SPX cannot break through the resistance zone of $1.55 or close firmly above the level of $1.61, the risk of a reversal will increase, causing the price to potentially return to test the important support area at $1.28. If this level is breached, the 50-day EMA around $1.02 will become the next target that the bears may aim for.
SN_Nour
Disclaimer: The information on this page may come from third parties and does not represent the views or opinions of Gate. The content displayed on this page is for reference only and does not constitute any financial, investment, or legal advice. Gate does not guarantee the accuracy or completeness of the information and shall not be liable for any losses arising from the use of this information. Virtual asset investments carry high risks and are subject to significant price volatility. You may lose all of your invested principal. Please fully understand the relevant risks and make prudent decisions based on your own financial situation and risk tolerance. For details, please refer to
Disclaimer.
