Trade
Basic
Futures
Futures
Hundreds of contracts settled in USDT or BTC
TradFi
Gold
Trade global traditional assets with USDT in one place
Options
Hot
Trade European-style vanilla options
Unified Account
Maximize your capital efficiency
Demo Trading
Futures Kickoff
Get prepared for your futures trading
Futures Events
Participate in events to win generous rewards
Demo Trading
Use virtual funds to experience risk-free trading
Earn
Launch
CandyDrop
Collect candies to earn airdrops
Launchpool
Quick staking, earn potential new tokens
HODLer Airdrop
Hold GT and get massive airdrops for free
Launchpad
Be early to the next big token project
Alpha Points
Trade on-chain assets and enjoy airdrop rewards!
Futures Points
Earn futures points and claim airdrop rewards
Investment
Simple Earn
Earn interests with idle tokens
Auto-Invest
Auto-invest on a regular basis
Dual Investment
Buy low and sell high to take profits from price fluctuations
Soft Staking
Earn rewards with flexible staking
Crypto Loan
0 Fees
Pledge one crypto to borrow another
Lending Center
One-stop lending hub
VIP Wealth Hub
Customized wealth management empowers your assets growth
Private Wealth Management
Customized asset management to grow your digital assets
Quant Fund
Top asset management team helps you profit without hassle
Staking
Stake cryptos to earn in PoS products
Smart Leverage
New
No forced liquidation before maturity, worry-free leveraged gains
GUSD Minting
Use USDT/USDC to mint GUSD for treasury-level yields
More
GennyCruz
No content yet
GennyCruz
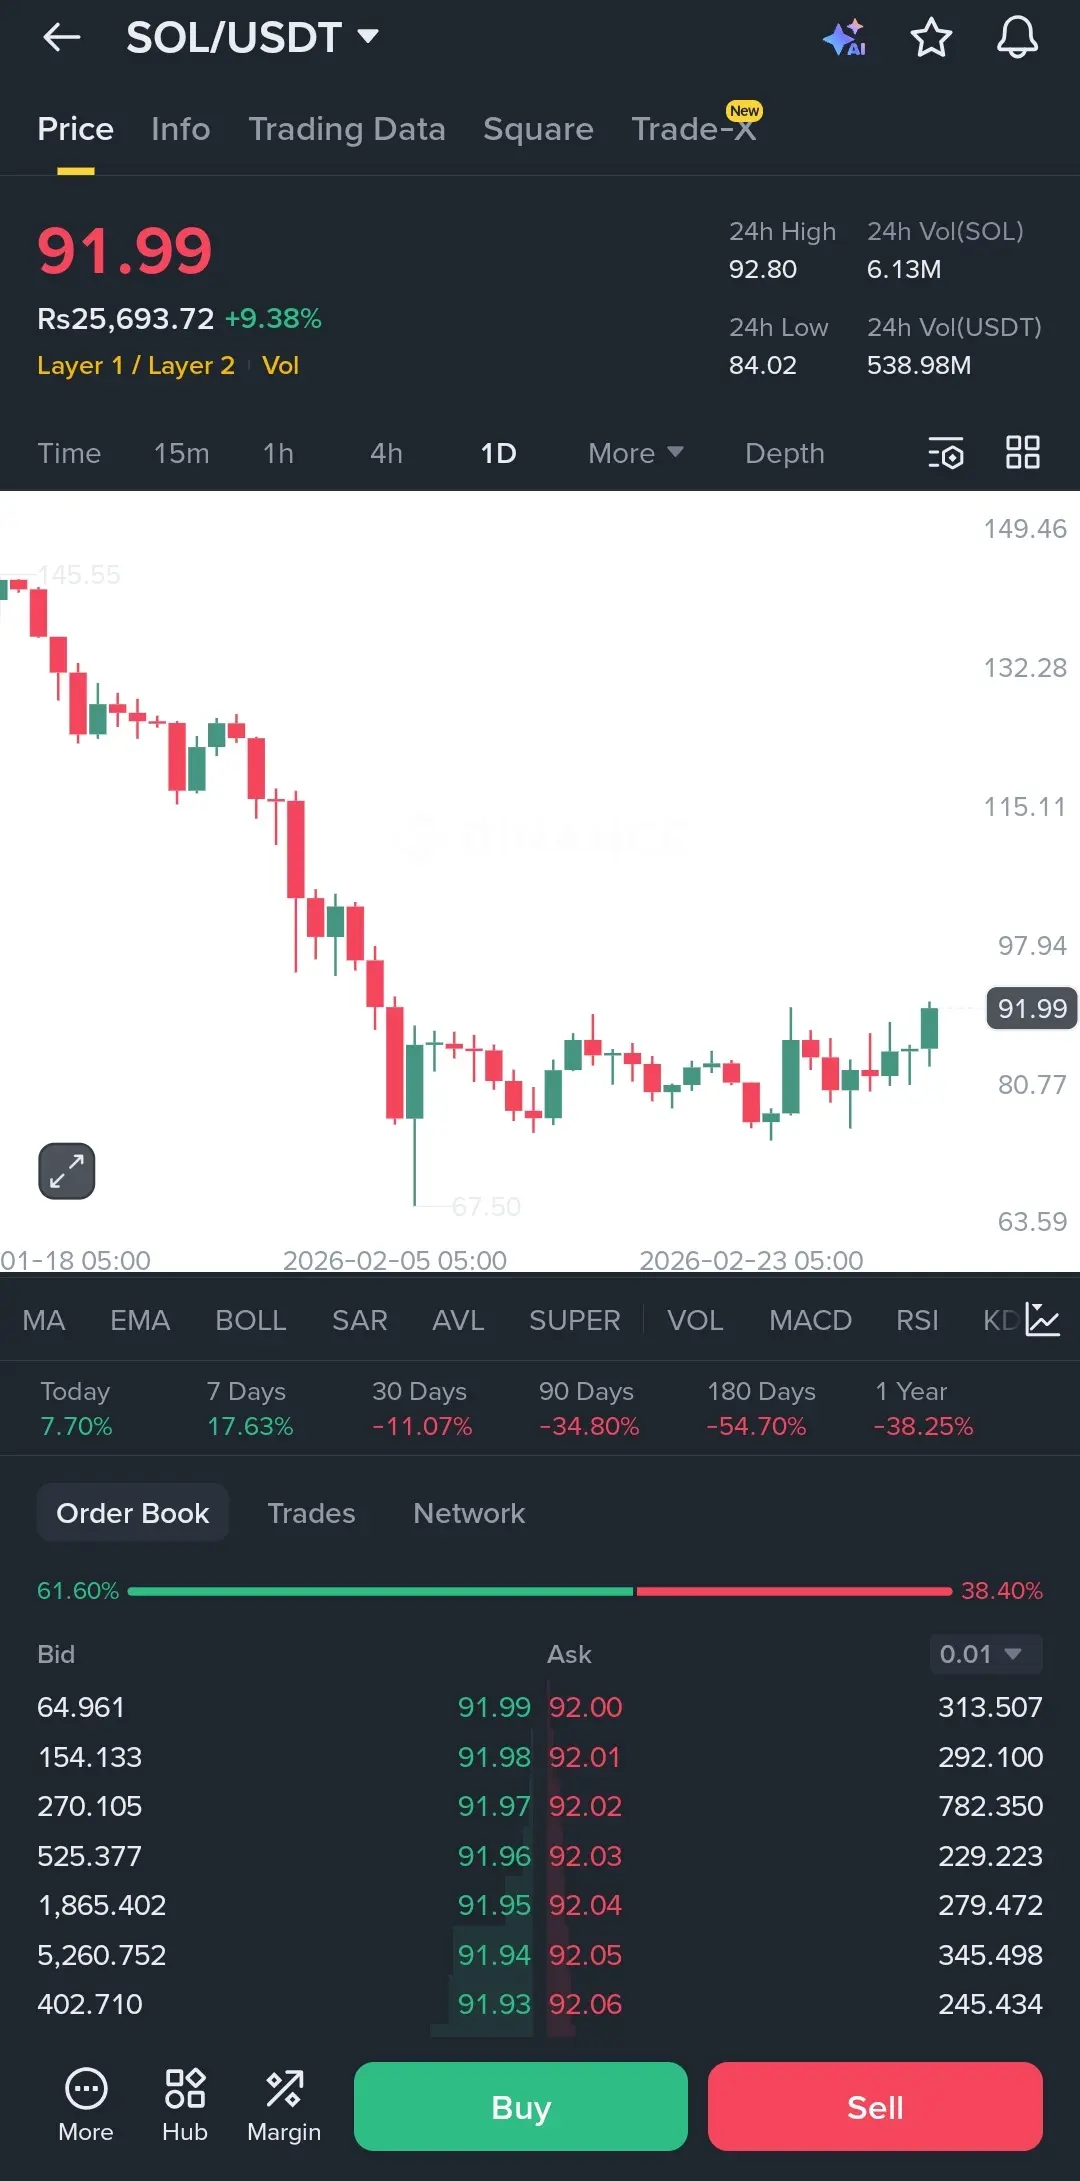
Everyone thought $SOL was heading to zero but the chart says otherwise.
Solana is finally showing some real strength after that massive flush to 67. We are currently trading at 91.99 and it feels like the momentum is shifting fast.
We just cleared a minor resistance at 80 and the bulls are now pushing toward that 97.94 level. If we can break and hold above 100 it’s going to catch a lot of people off guard.
The volume is looking solid today with over 538 million USDT flowing in. It’s not just a small bounce anymore; this is a proper attempt at a trend reversal.
I’m watching the support at 8
SOL9,13%

- Reward
- like
- Comment
- Repost
- Share
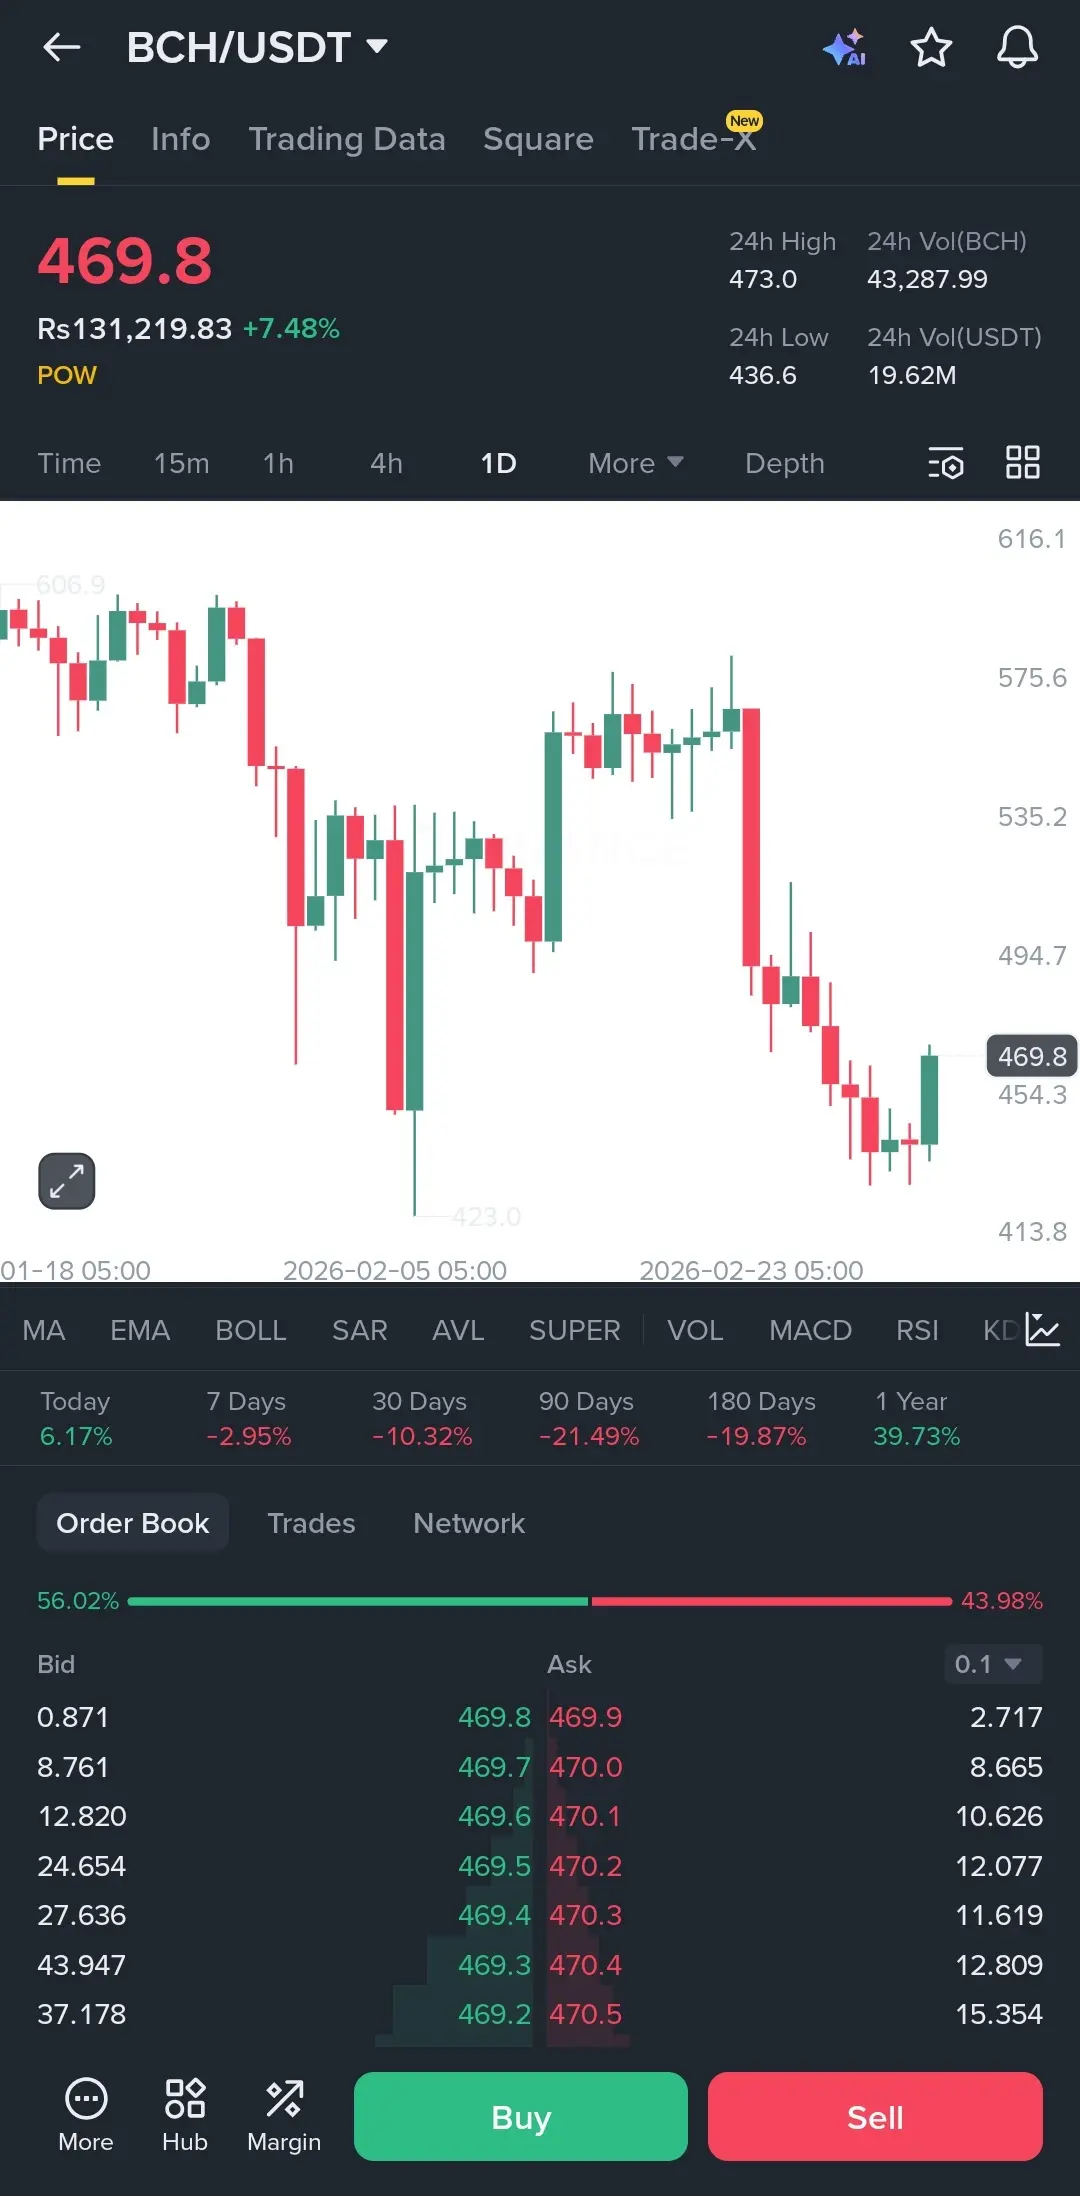
I can't believe people are actually shorting $BCH right here.
BCH is putting in a really interesting recovery candle after that brutal drop to 423. We are sitting at 469.8 right now and it looks like the bulls are finally trying to step up.
The price action just cleared that minor hurdle around 454 and now we are staring down the next resistance zone near 494. If we can get a solid daily close above 475 it might trigger some serious FOMO back toward the 500 level.
Volume is starting to show some life but it's not a massive breakout yet. It feels like we are just consolidating after the init
BCH7,2%

- Reward
- like
- Comment
- Repost
- Share
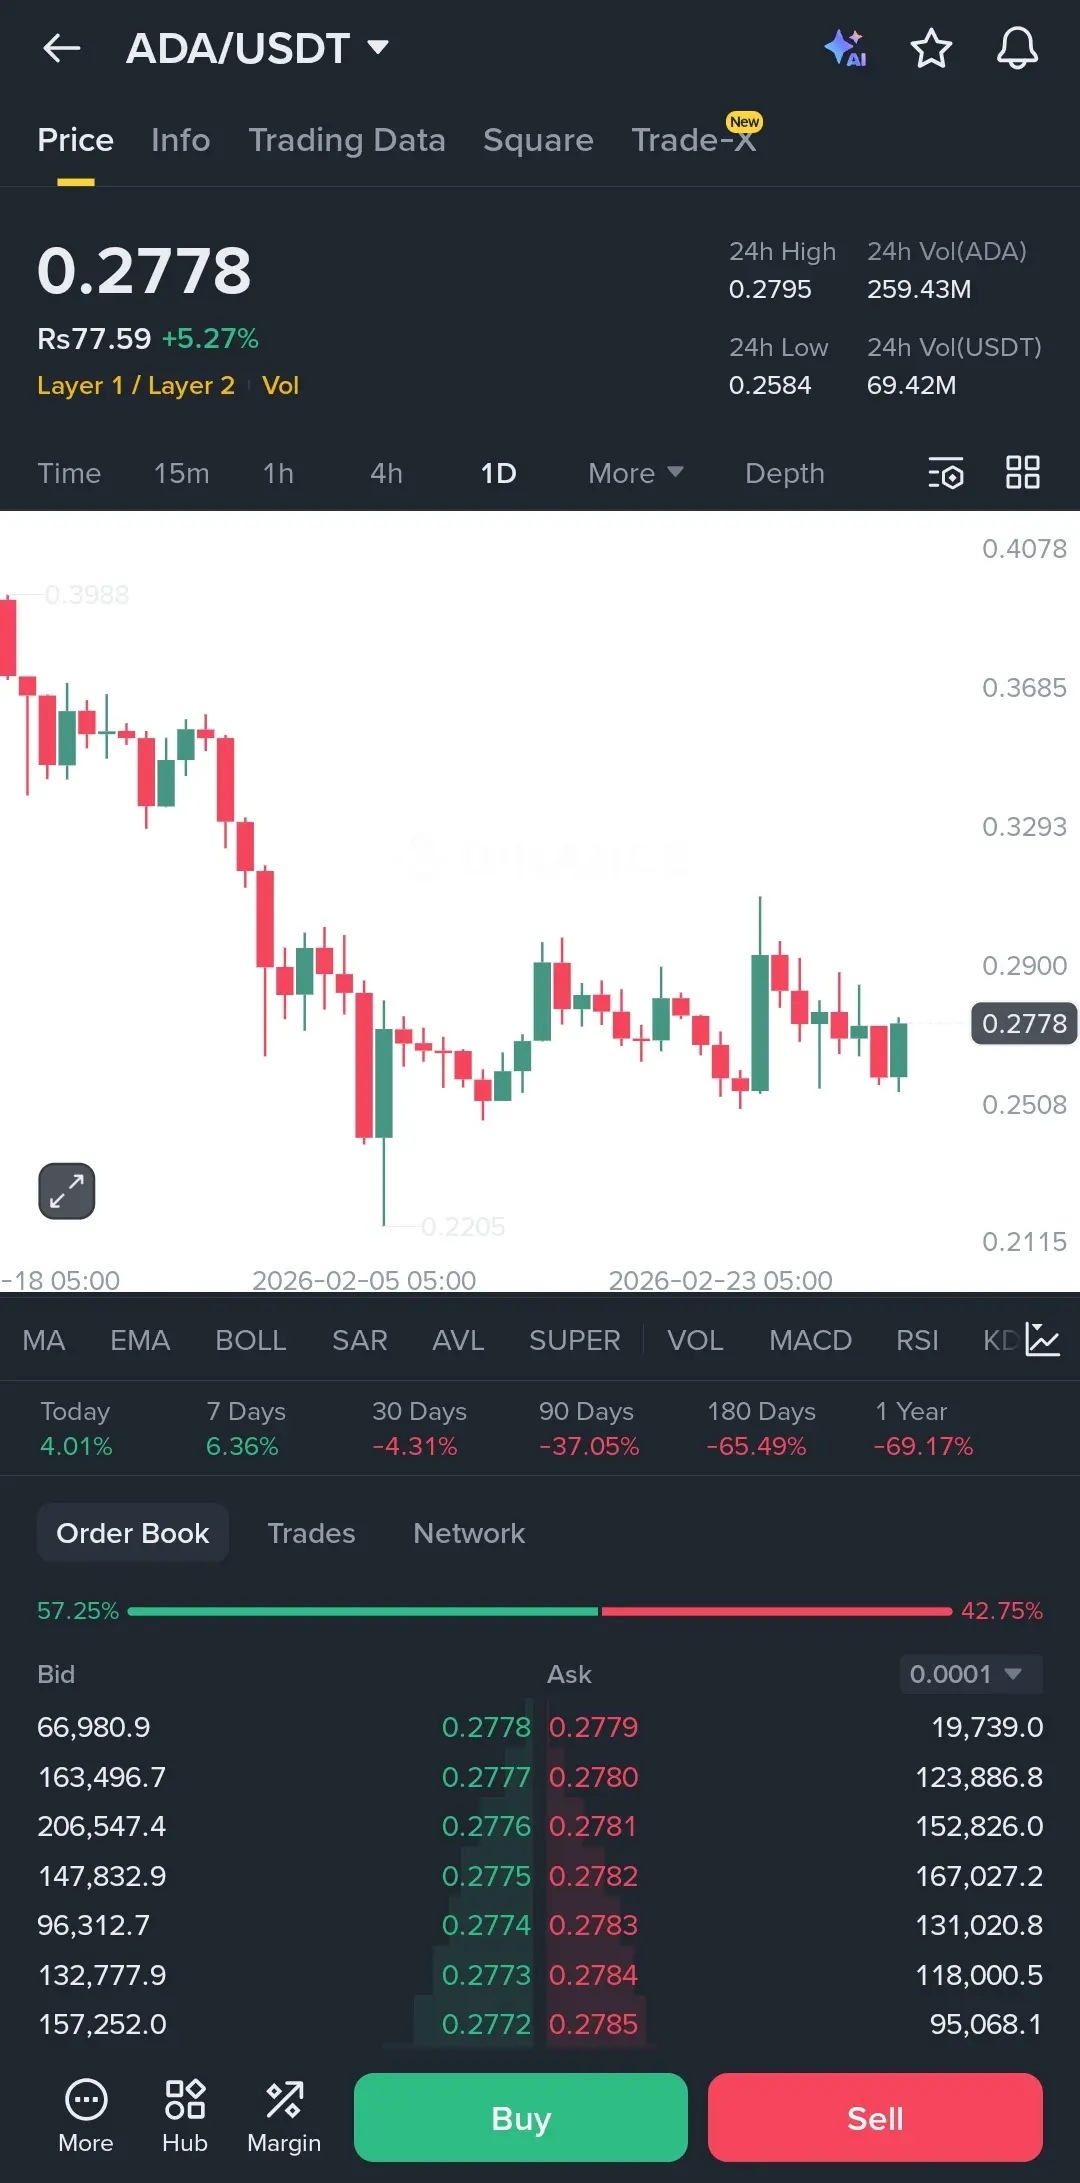
Is Cardano finally waking up or is this just another trap for the retail crowd?
$ADA has been bleeding out for months but it looks like we finally found some solid footing around that 0.22 zone. Right now we are sitting at 0.2778 and trying to string together some green days to change the trend.
The price action is getting interesting because we are bumping our heads against a local resistance level that has rejected us a few times lately. If we can flip 0.29 into support then we might actually have a shot at testing 0.33 again.
Volume is okay but nothing crazy yet so I'm not getting overl
ADA5,9%

- Reward
- like
- Comment
- Repost
- Share
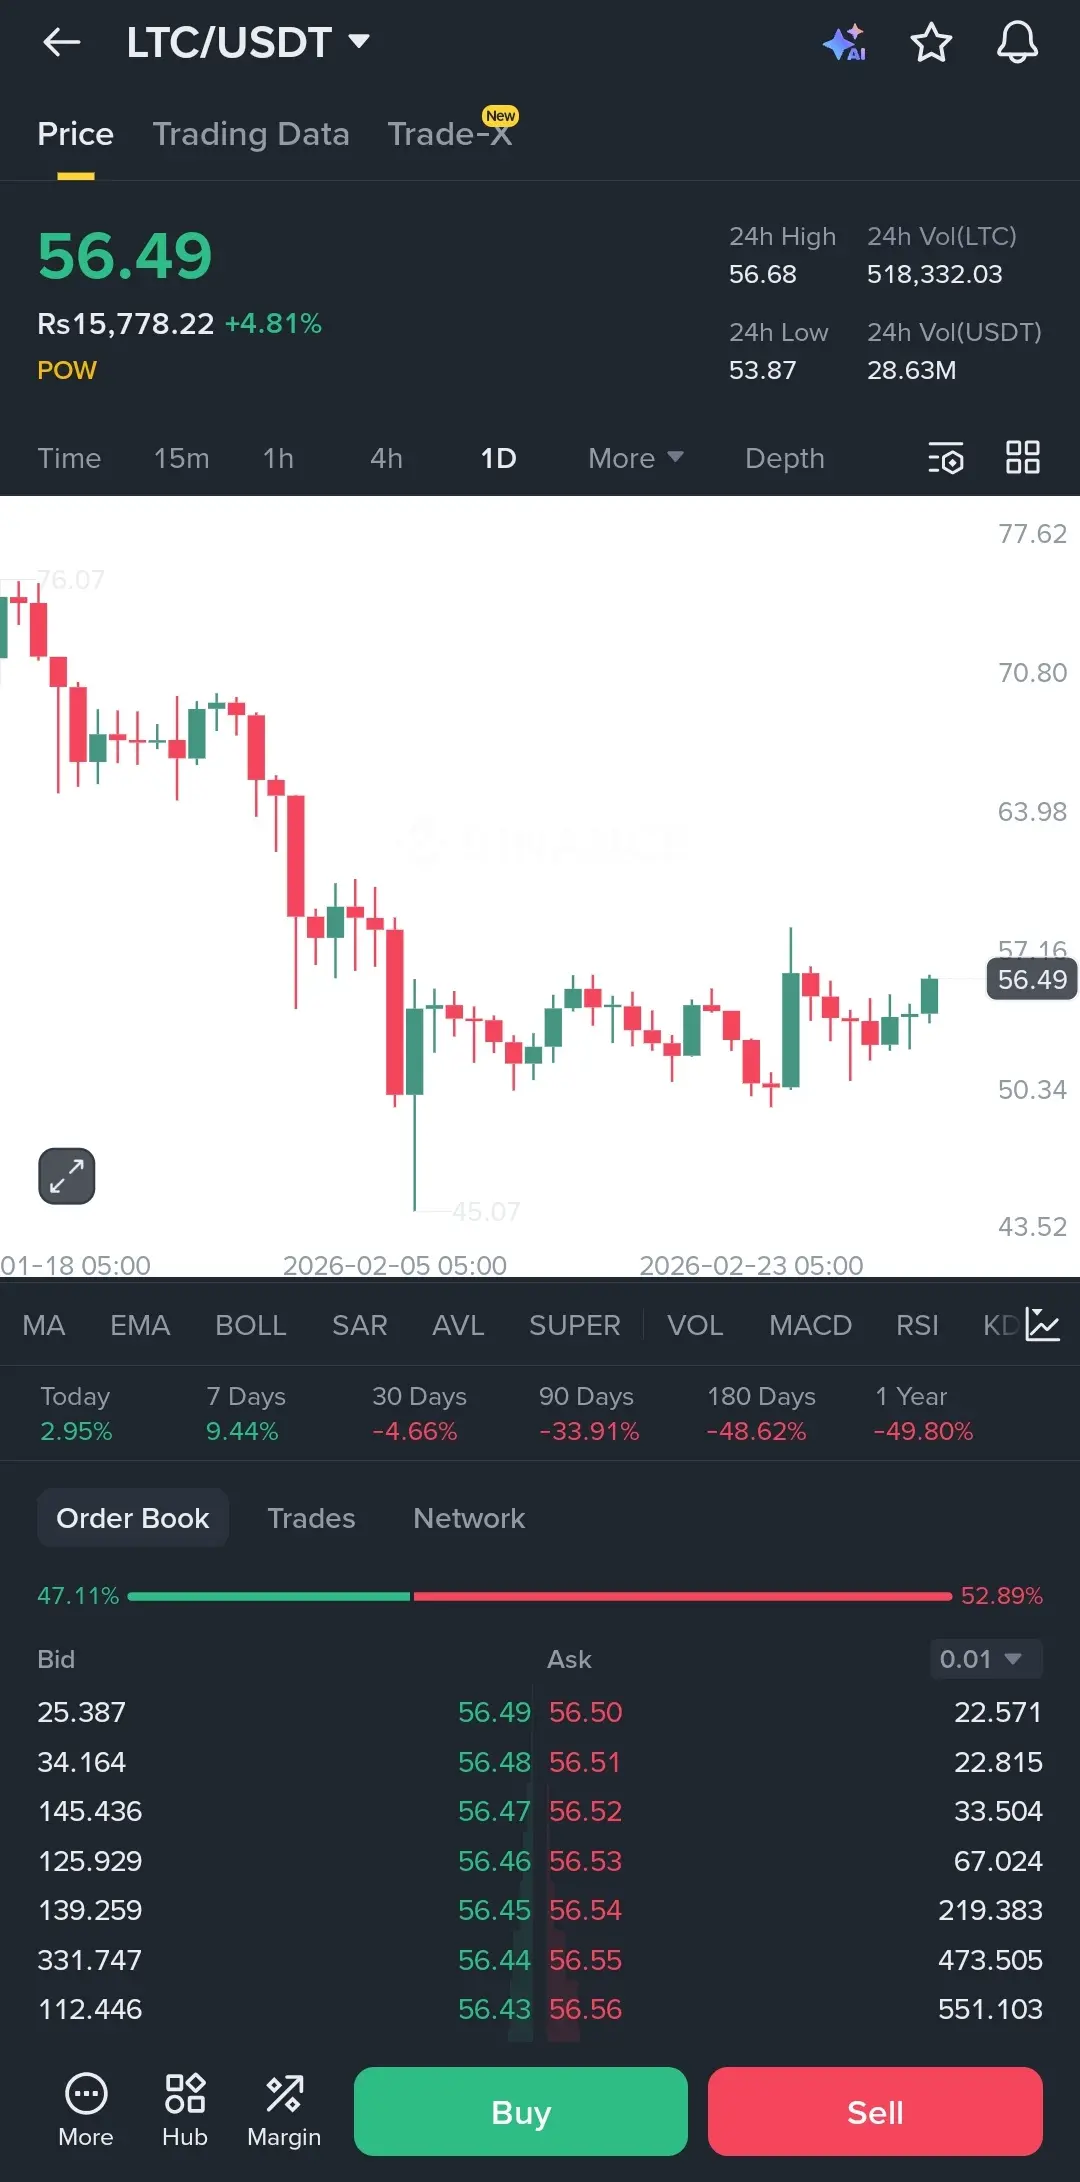
Did everyone seriously give up on $LTC already?
LTC/USDT is quietly putting in some work while no one is looking. We’ve been stuck in this range between 50 and 57 for what feels like forever.
The price is currently sitting at 56.49 and it’s grinding right against that local resistance. If we can actually close a daily candle above this zone we might finally see some decent momentum back toward 64 or even 70.
Support at 50 has held up well enough but the volume is still pretty dry. It needs a real push to break this boring sideways phase.
I’m keeping an eye on it because these slow grinds u
LTC4,93%

- Reward
- 1
- Comment
- Repost
- Share
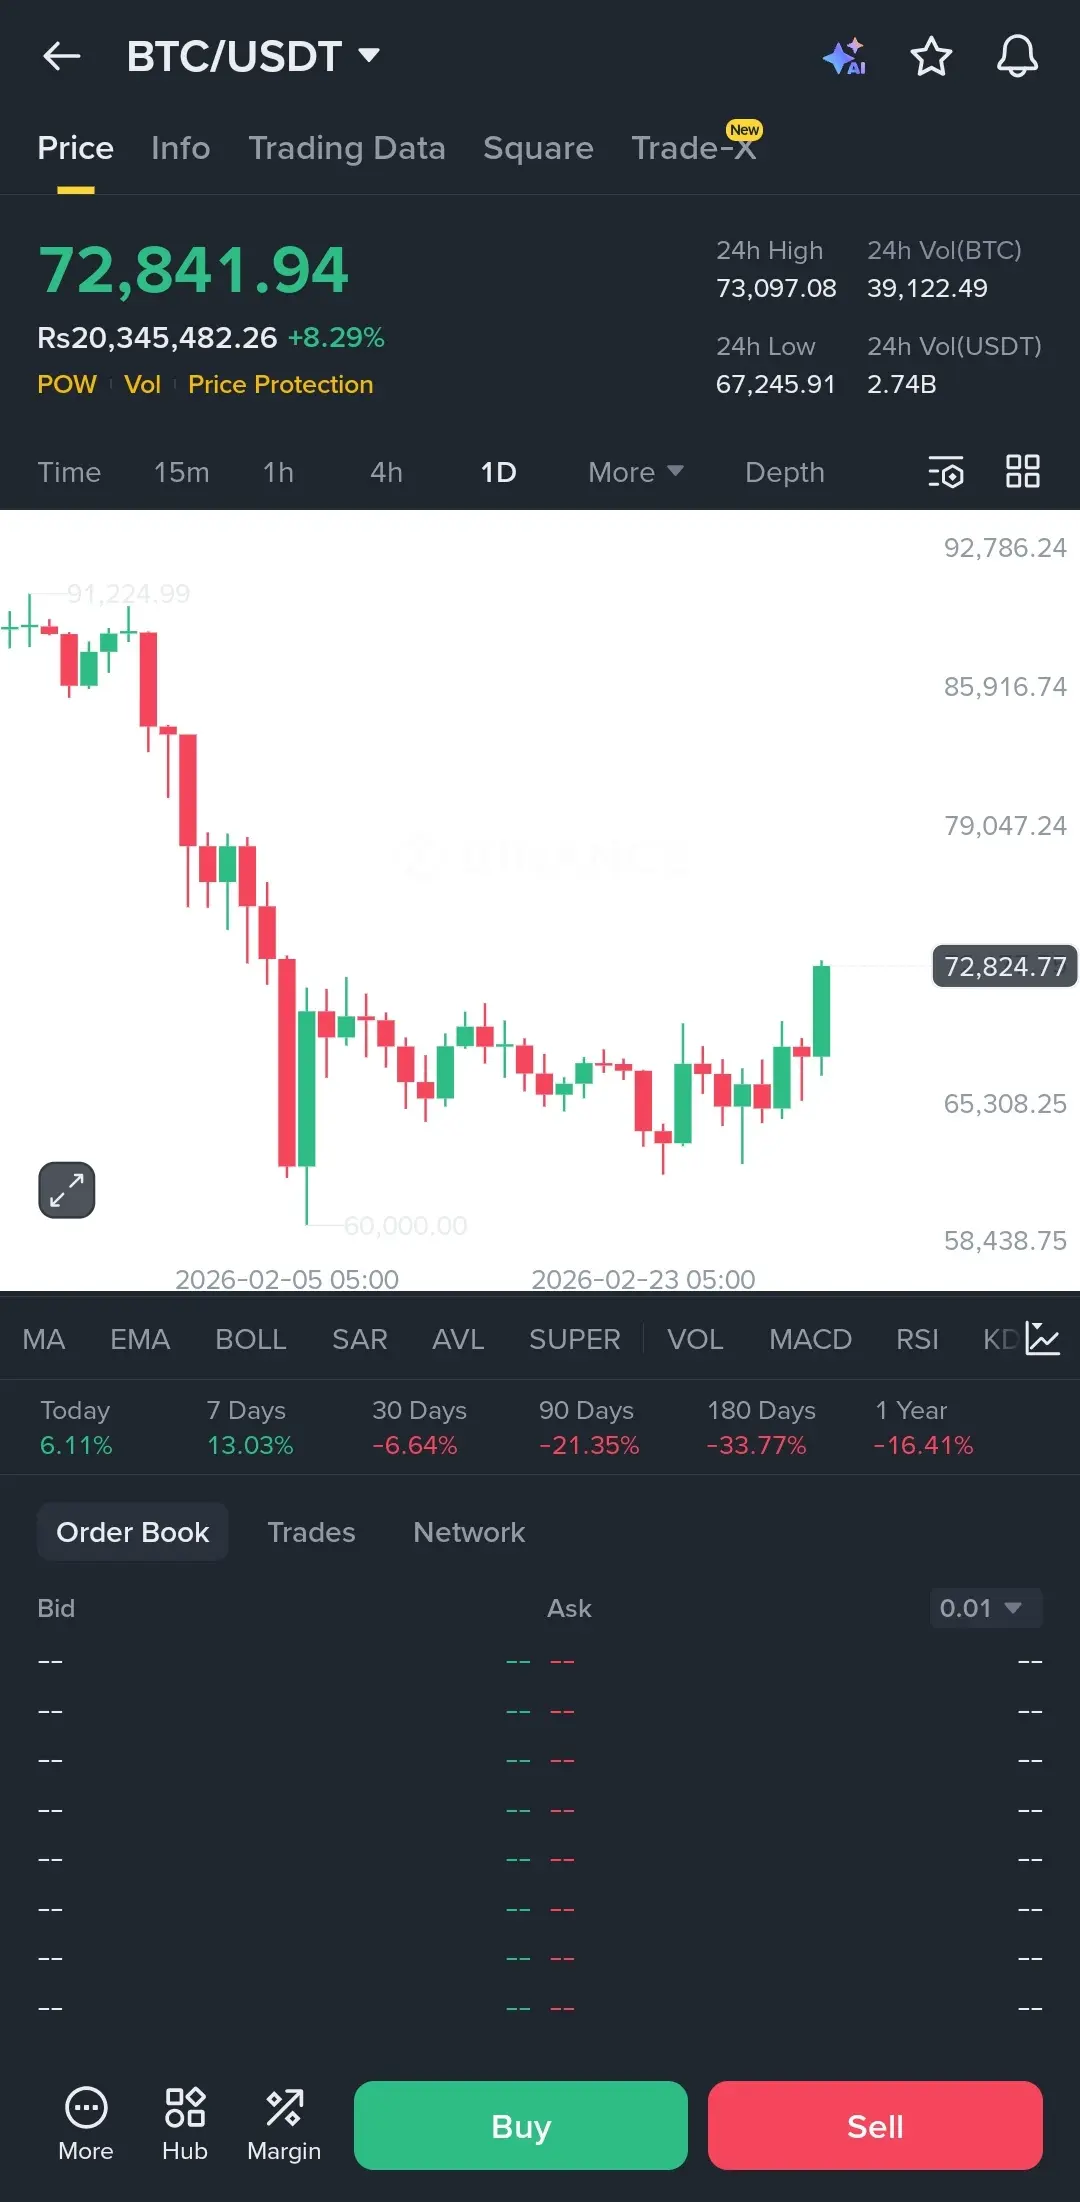
$BTC is finally showing some life after that nasty slide. Everyone was calling for 50k but the bulls held that 60k floor like their lives depended on it.
Looking at this daily candle it’s a massive breakout from that tight consolidation we’ve been stuck in for weeks. We just cleared the local resistance around 70k with some decent strength.
The volume is picking up and we are currently sitting at 72.8k. If we can flip this level into support the next stop is likely testing those previous highs near 80k.
I’m watching the 4h close closely. If we wick back down it might just be a fakeout but
BTC8,22%
- Reward
- like
- Comment
- Repost
- Share
$SUI I is playing a dangerous game right now and most people are looking the wrong way.
We’ve been stuck in this boring sideways range for weeks after that massive drop from the 1.80 levels. Every time we try to push past 0.96, the sellers just shut it down.
The price is currently sitting at 0.8991 and honestly, it looks heavy. If we lose this 0.88 support area, there isn't much stopping a quick slide back down to that 0.78 wick.
Volume is pretty flat, which tells me the big players are just waiting for a liquidiation hunt before choosing a real direction. I'm not touching this until we eithe
SUI8,07%


- Reward
- like
- Comment
- Repost
- Share
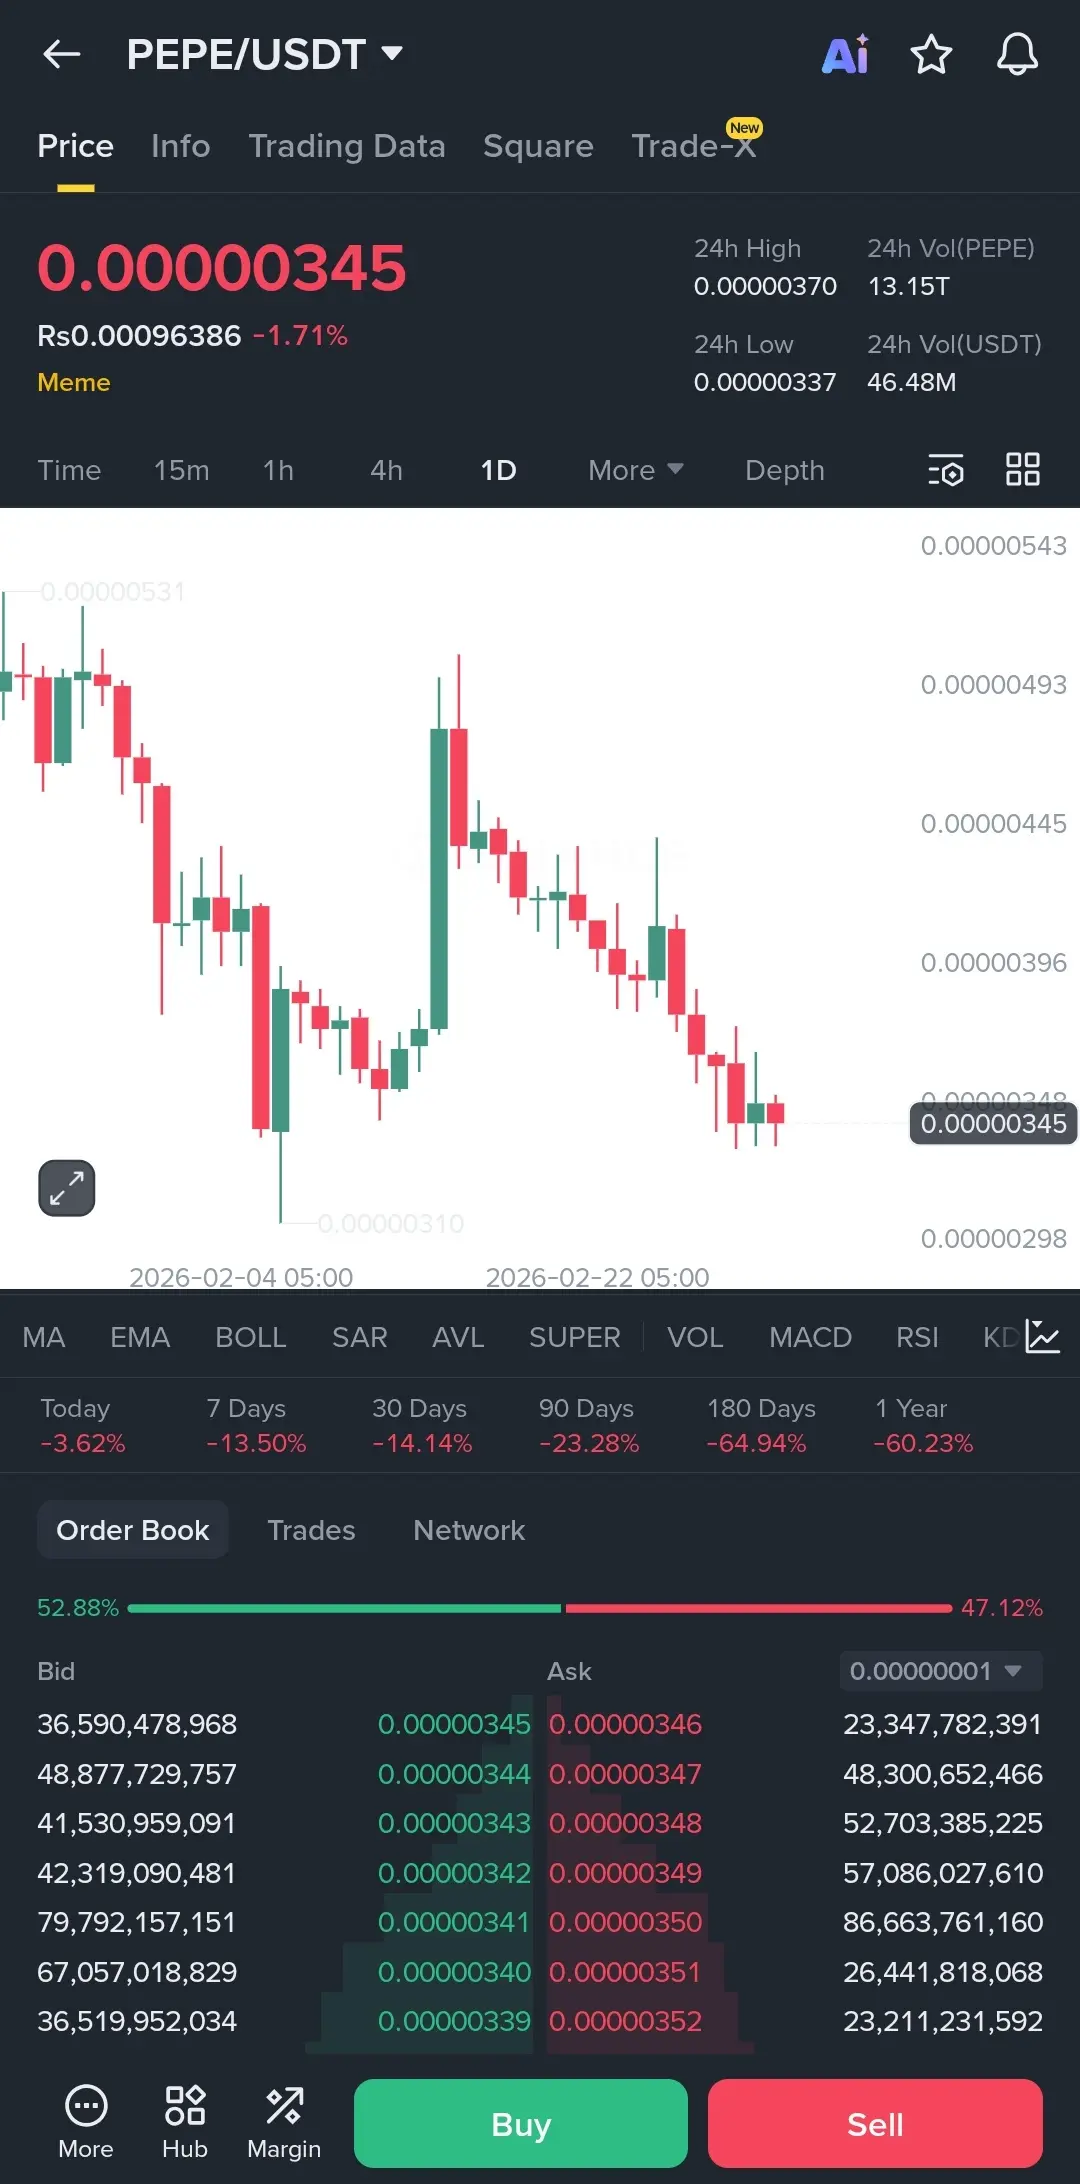
Man, everyone was waiting for that big $PEPE bounce, but the candles are telling a different story right now.
Looking at the daily, we just can’t seem to shake this downtrend. We had that nice spike back in mid-February, but it got sold off fast and now we’re sitting at 0.00000345.
The scary part? We are hovering right above that previous support at 0.00000310. If the buyers don't step up there, it could get ugly. Volume is looking a bit dry too, which usually means the big moves are still loading.
I’m staying patient. If we hold 310, I might look for a scalp, but right now it feels like c
PEPE8,07%

- Reward
- 2
- Comment
- Repost
- Share
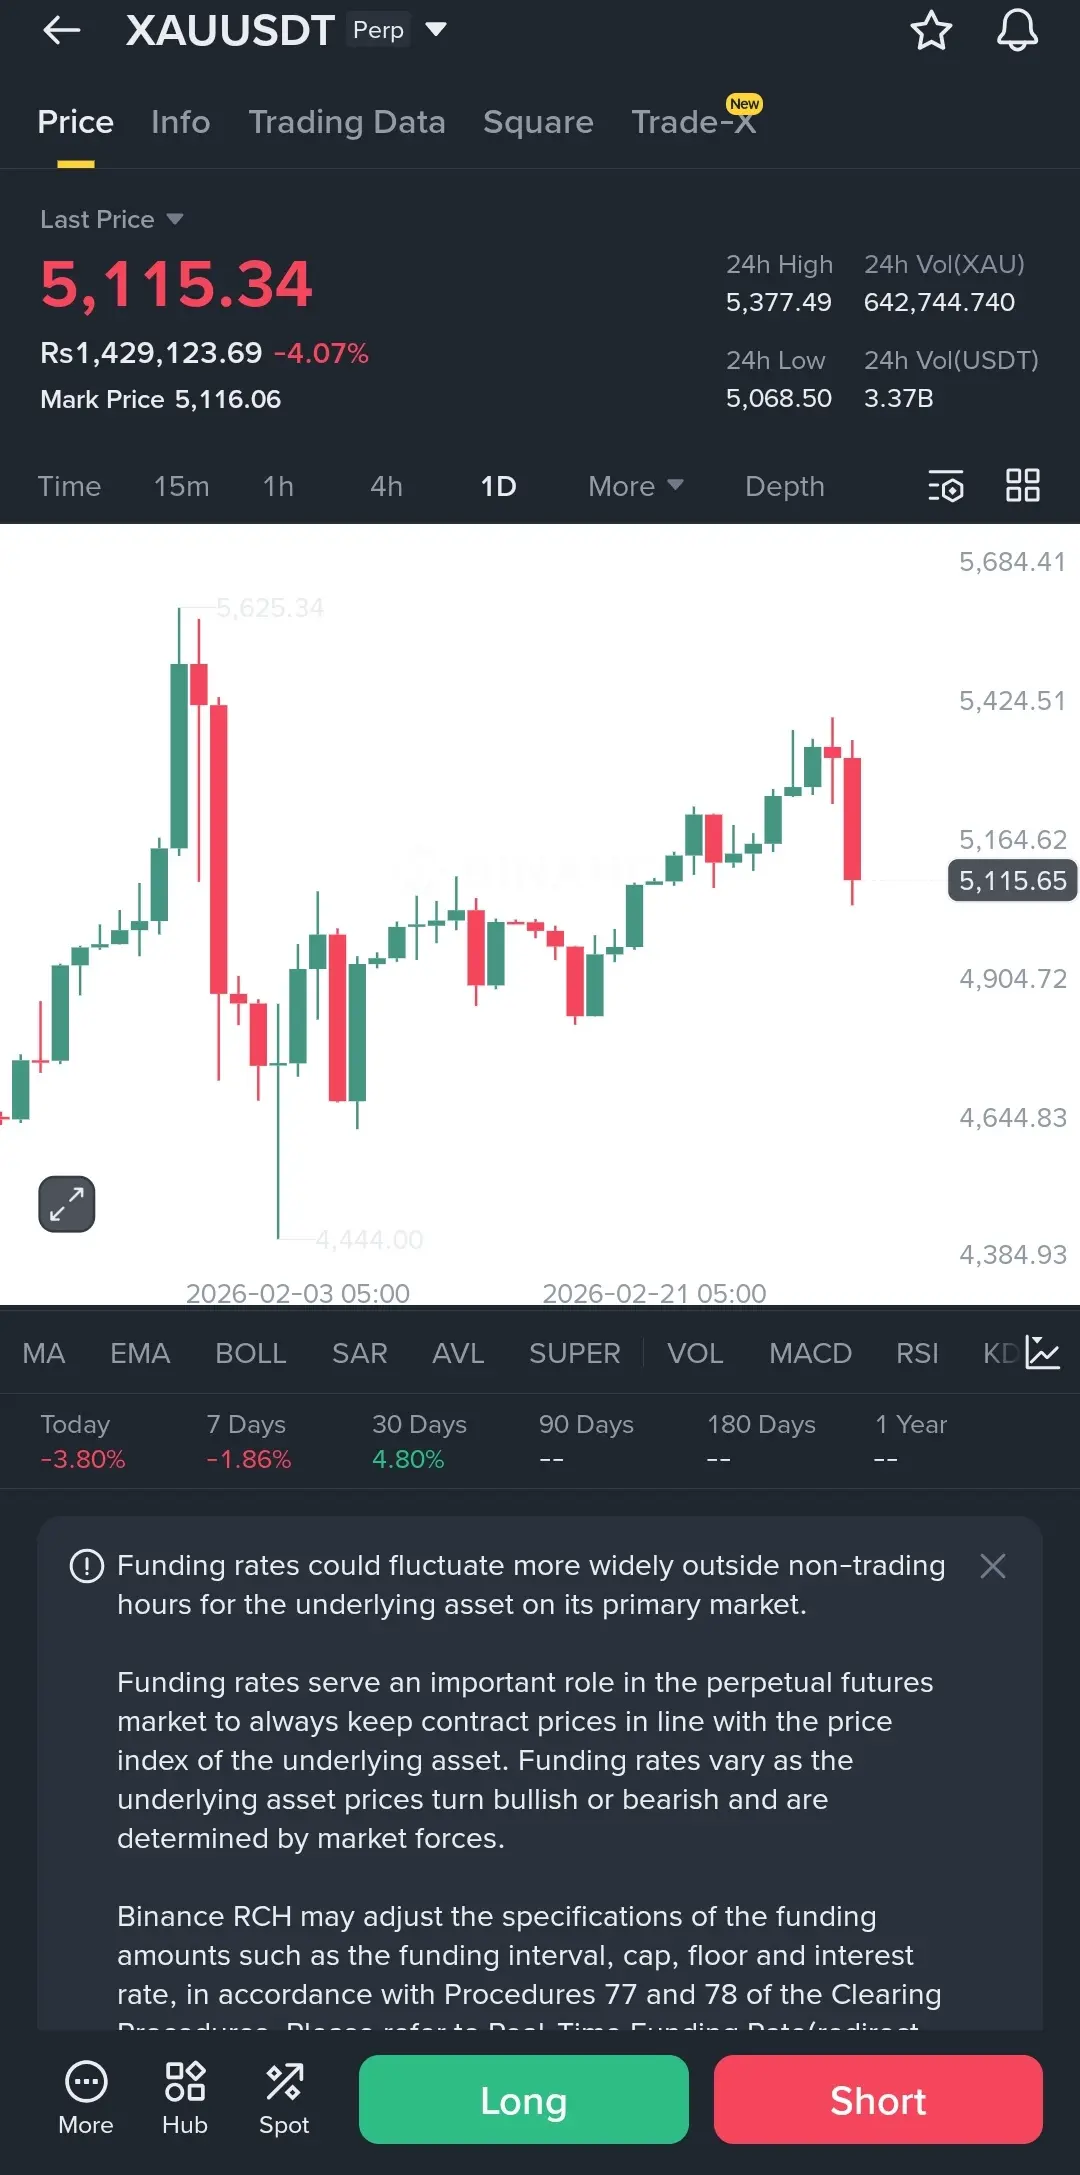
$XAU is doing that thing again where it makes everyone second-guess their entire strategy.
We just saw a pretty sharp rejection from the 5,400 area and now we’re sitting at 5,115. It looks like the market is trying to decide if this is just a healthy pullback or the start of a deeper slide back toward the 4,900 support zone.
The red candle from today is fairly aggressive, wiping out a few days of slow gains in one go. If we don’t see some buyers step in around this 5,100 level soon, we might be looking at a retest of the previous lows near 4,800.
I'm staying on the sidelines for a bit. Cat

- Reward
- 3
- Comment
- Repost
- Share
$XAU is doing that thing again where it makes everyone second-guess their entire strategy.
We just saw a pretty sharp rejection from the 5,400 area and now we’re sitting at 5,115. It looks like the market is trying to decide if this is just a healthy pullback or the start of a deeper slide back toward the 4,900 support zone.
The red candle from today is fairly aggressive, wiping out a few days of slow gains in one go. If we don’t see some buyers step in around this 5,100 level soon, we might be looking at a retest of the previous lows near 4,800.
I'm staying on the sidelines for a bit. Cat
We just saw a pretty sharp rejection from the 5,400 area and now we’re sitting at 5,115. It looks like the market is trying to decide if this is just a healthy pullback or the start of a deeper slide back toward the 4,900 support zone.
The red candle from today is fairly aggressive, wiping out a few days of slow gains in one go. If we don’t see some buyers step in around this 5,100 level soon, we might be looking at a retest of the previous lows near 4,800.
I'm staying on the sidelines for a bit. Cat
- Reward
- 2
- Comment
- Repost
- Share
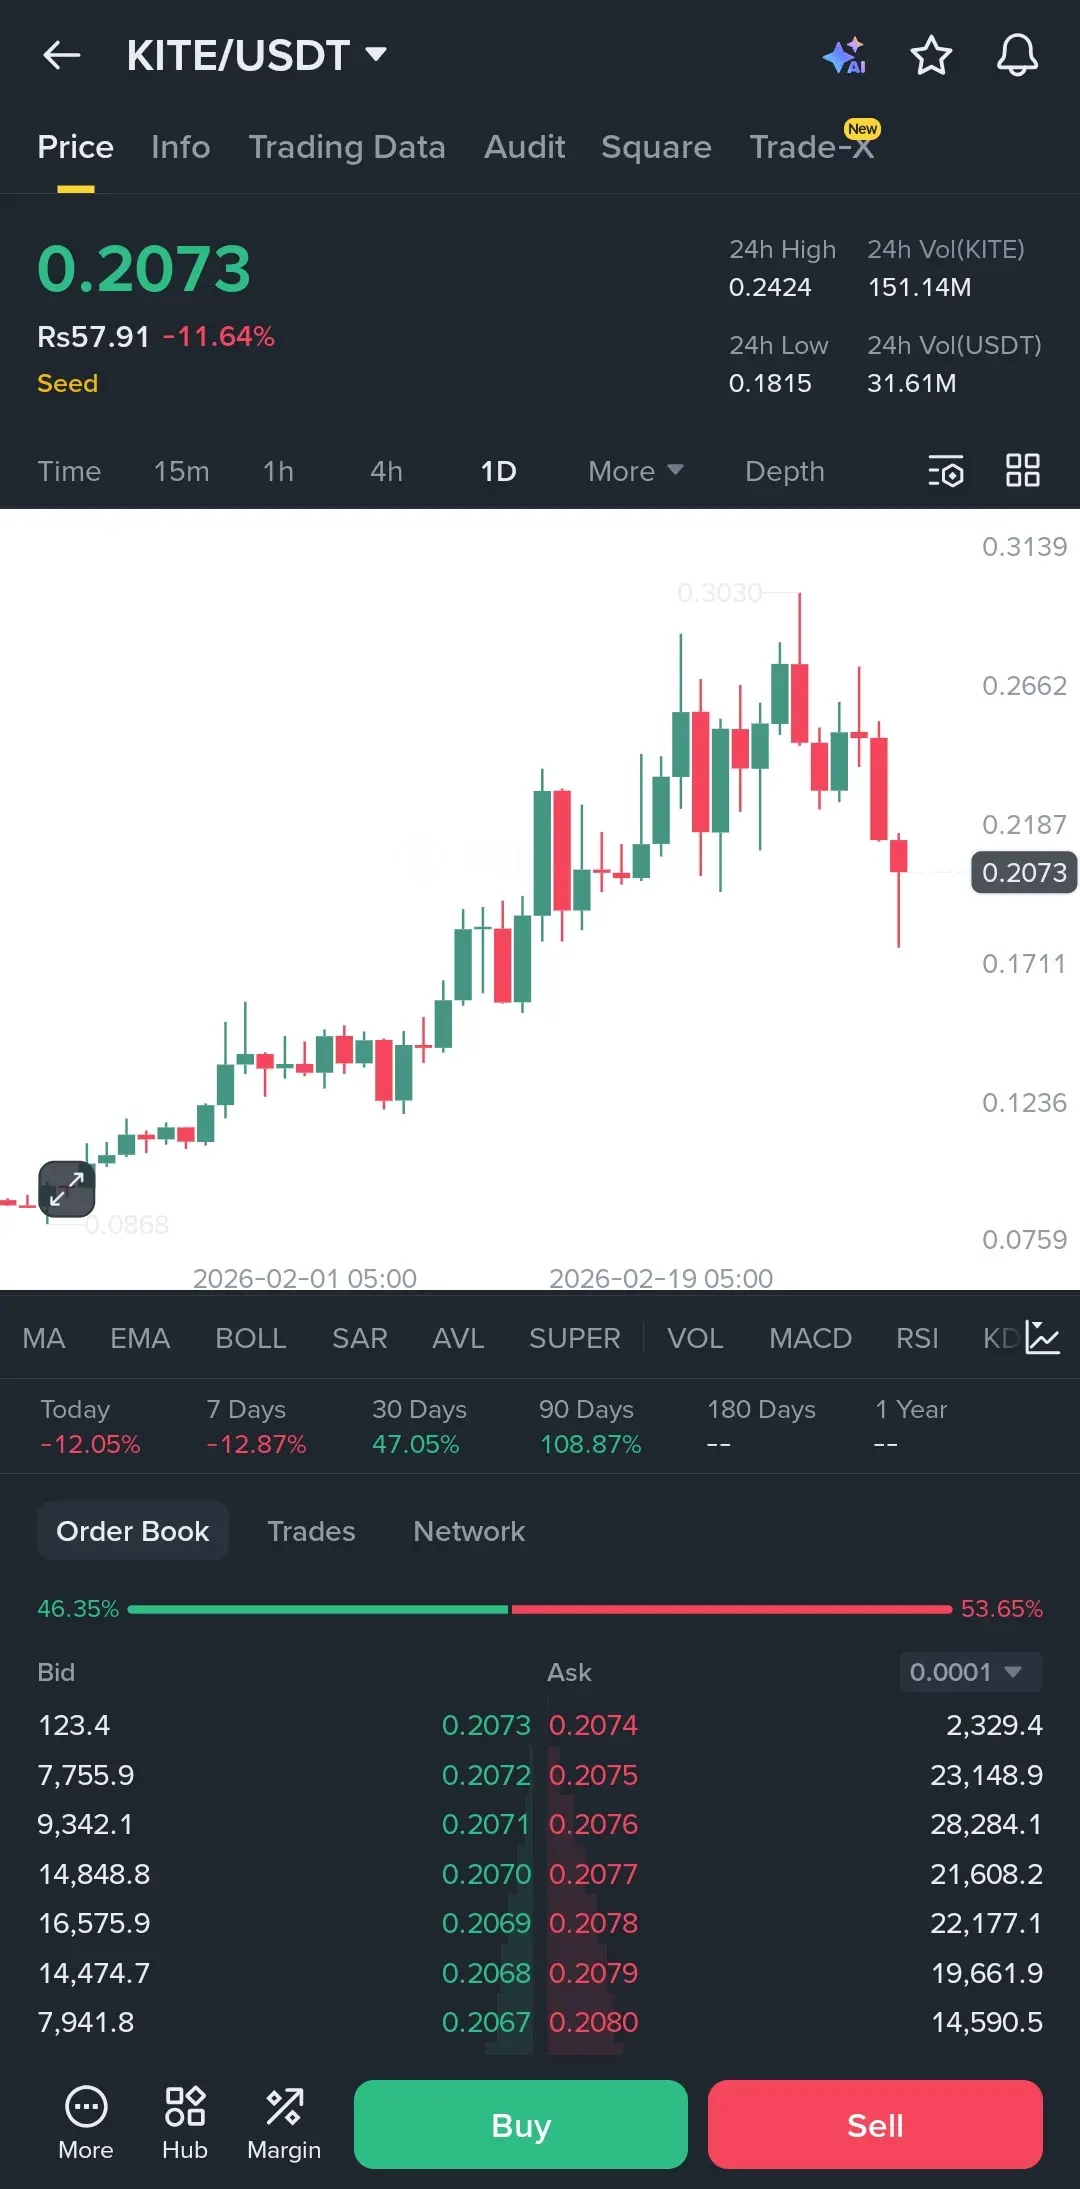
$KITE is moving exactly how we expected, but nobody is talking about what happens next.
Price just hit a major roadblock near 0.30 and got rejected hard. We've dropped about 11% today, and it looks like it's hunting for a place to rest.
The level to watch right now is 0.18. It held up as strong support earlier in February, so if it touches that area, I'm looking for a bounce. If it slices through that, we might be heading back to the 0.15 zone where the big volume lives.
Sellers are definitely in control at the moment with 53% on the ask side. I’m staying patient and waiting for the bleedi
KITE5,76%

- Reward
- 1
- Comment
- Repost
- Share
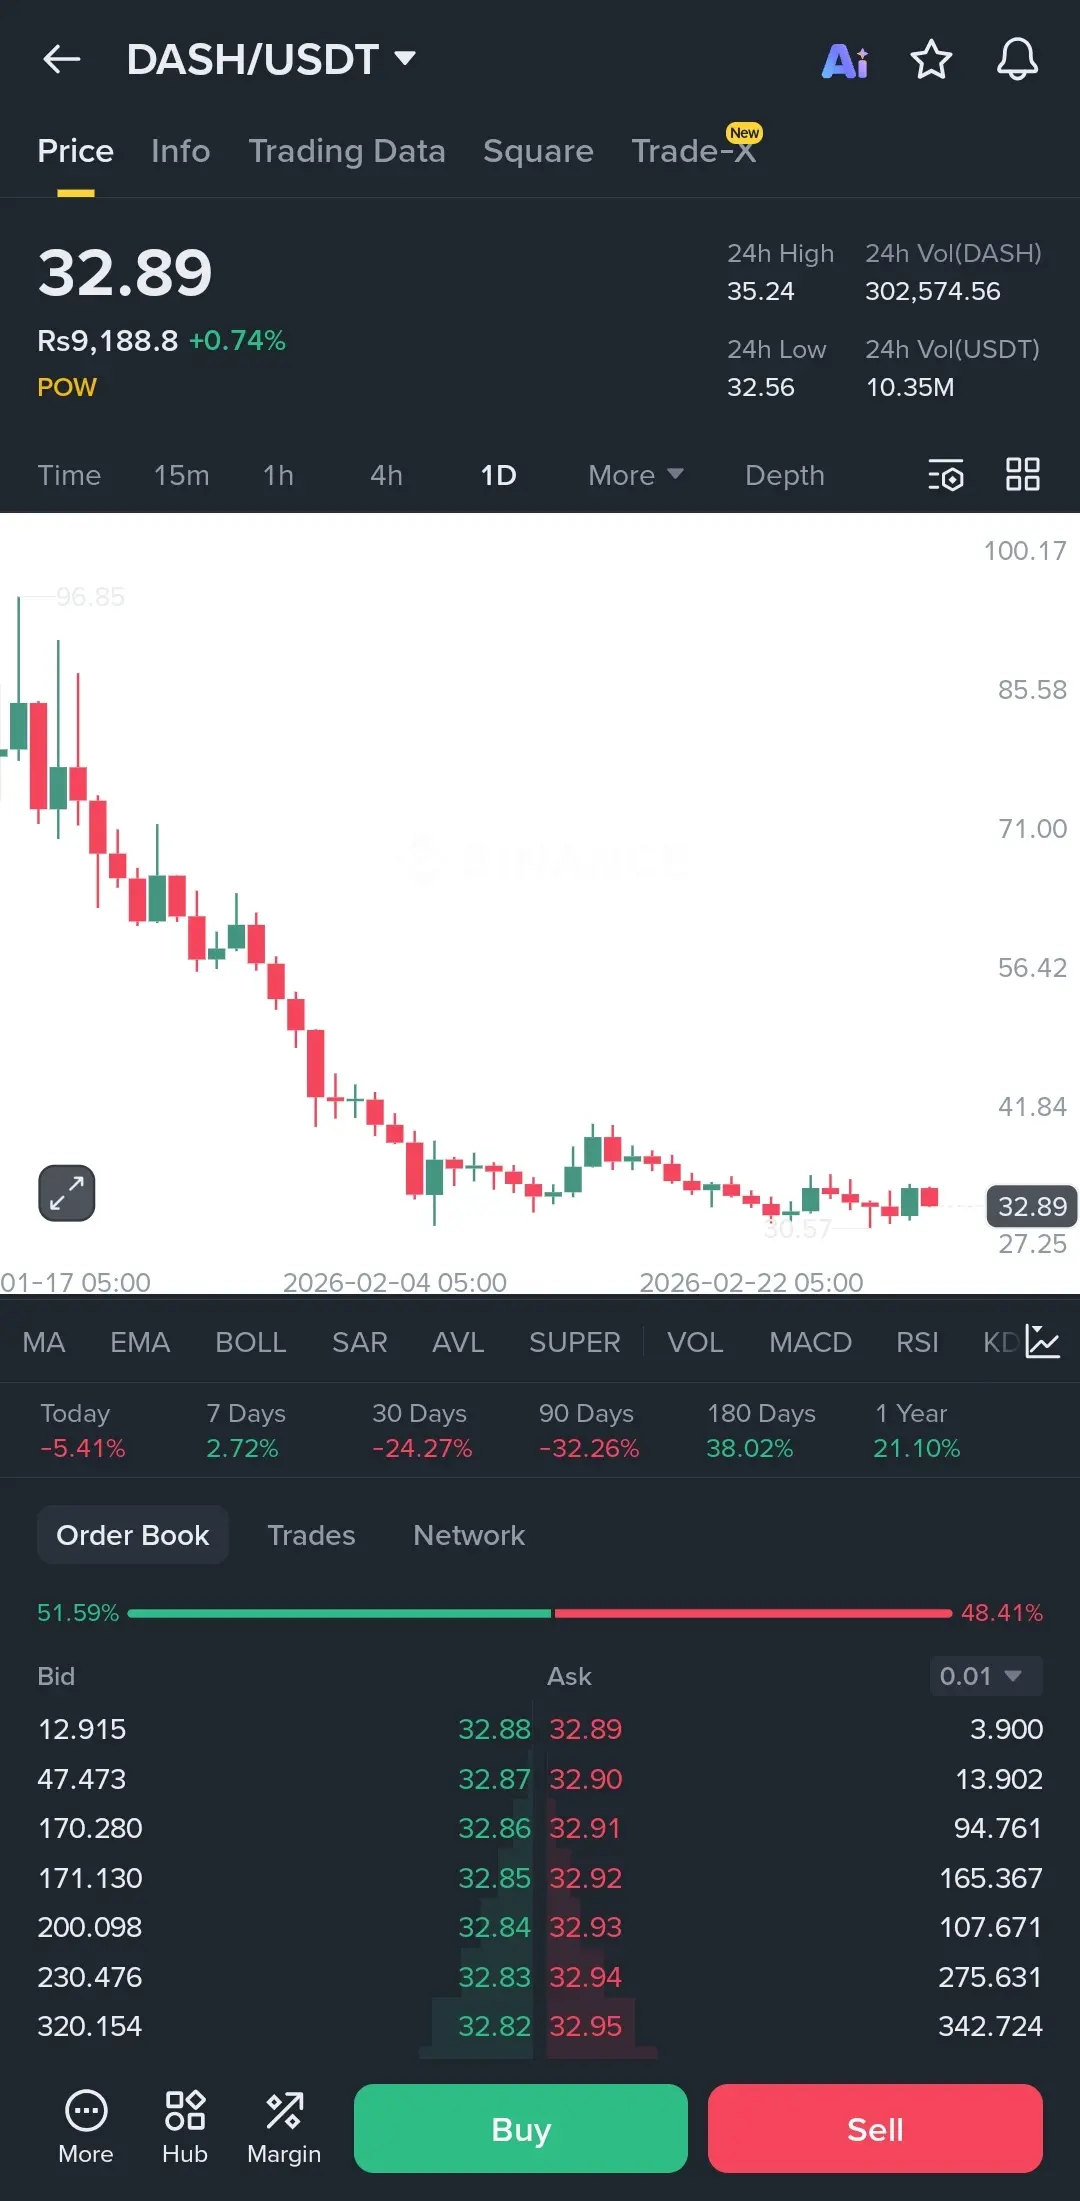
Something’s brewing with $DASH and most people are looking the other way.
The chart looks like it’s finally tired of falling. We’ve been sliding for weeks, but look at that floor it’s building around 30.50. It’s not a massive pump yet, but the way it’s hovering at 32.89 suggests the sellers are running out of steam.
If it manages to flip this little consolidation zone into support, we might actually see a decent relief rally toward 40. The volume is still quiet, which usually happens right before a big move.
I’m watching that 32.50 level closely. If it holds, we’re good. If it breaks, the
DASH8,36%

- Reward
- 1
- Comment
- Repost
- Share
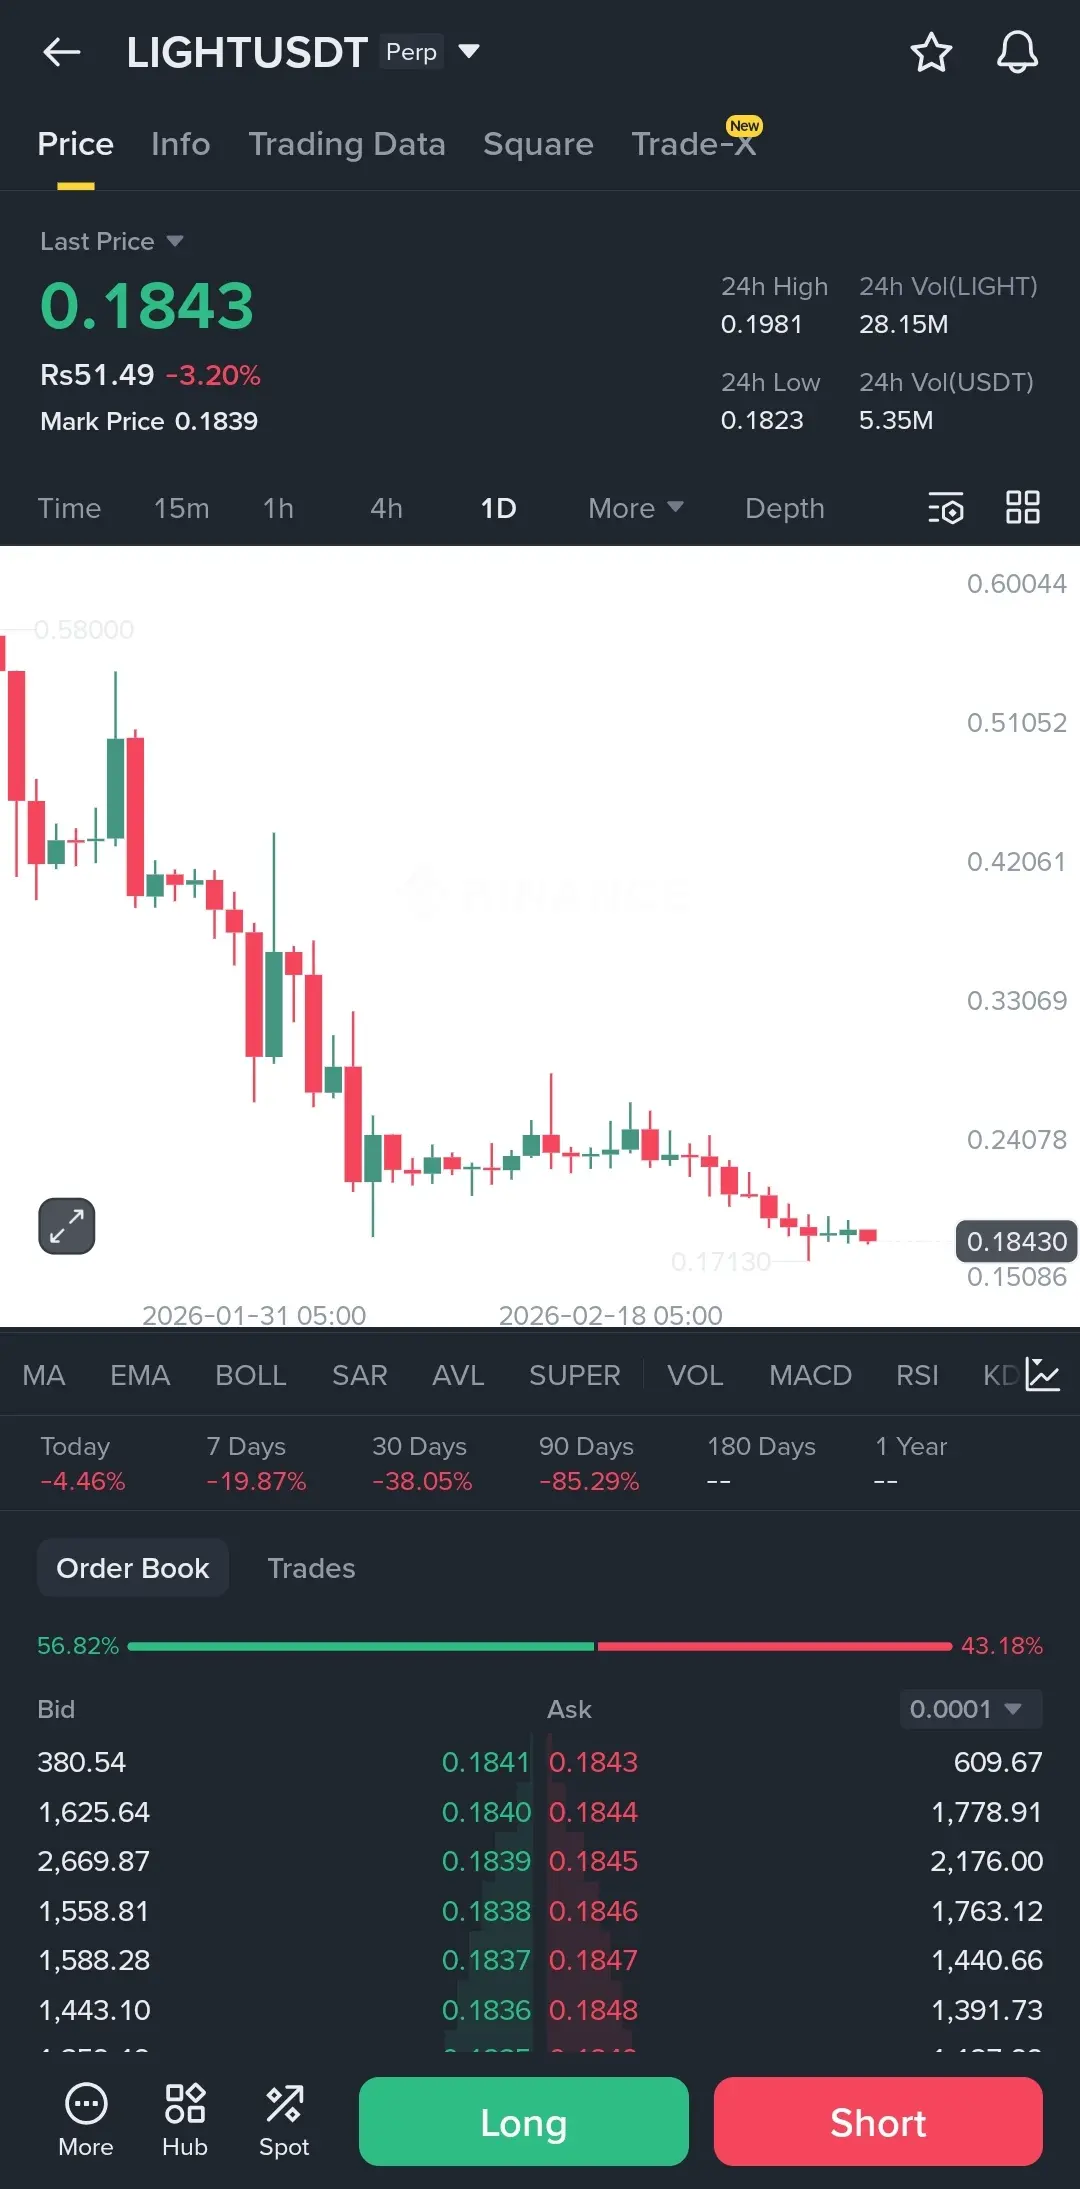
Is $LIGHT actually trying to pull a fast one on us right now?
I’ve been staring at this chart for a while and it’s looking pretty exhausting. We’re sitting at 0.1843 and the trend has been a straight slide down from the 0.50s. Every little bounce just gets sold into immediately.
We just hit a 24h low of 0.1823. If that level doesn’t hold as support, we are likely looking at a drop toward 0.171 or even lower because there’s just no strength here.
Volume is around 5.35M USDT which is decent but not exactly "reversal" volume. The order book shows about 56% buyers but it feels like they are ju
LIGHT2,21%

- Reward
- 1
- Comment
- Repost
- Share
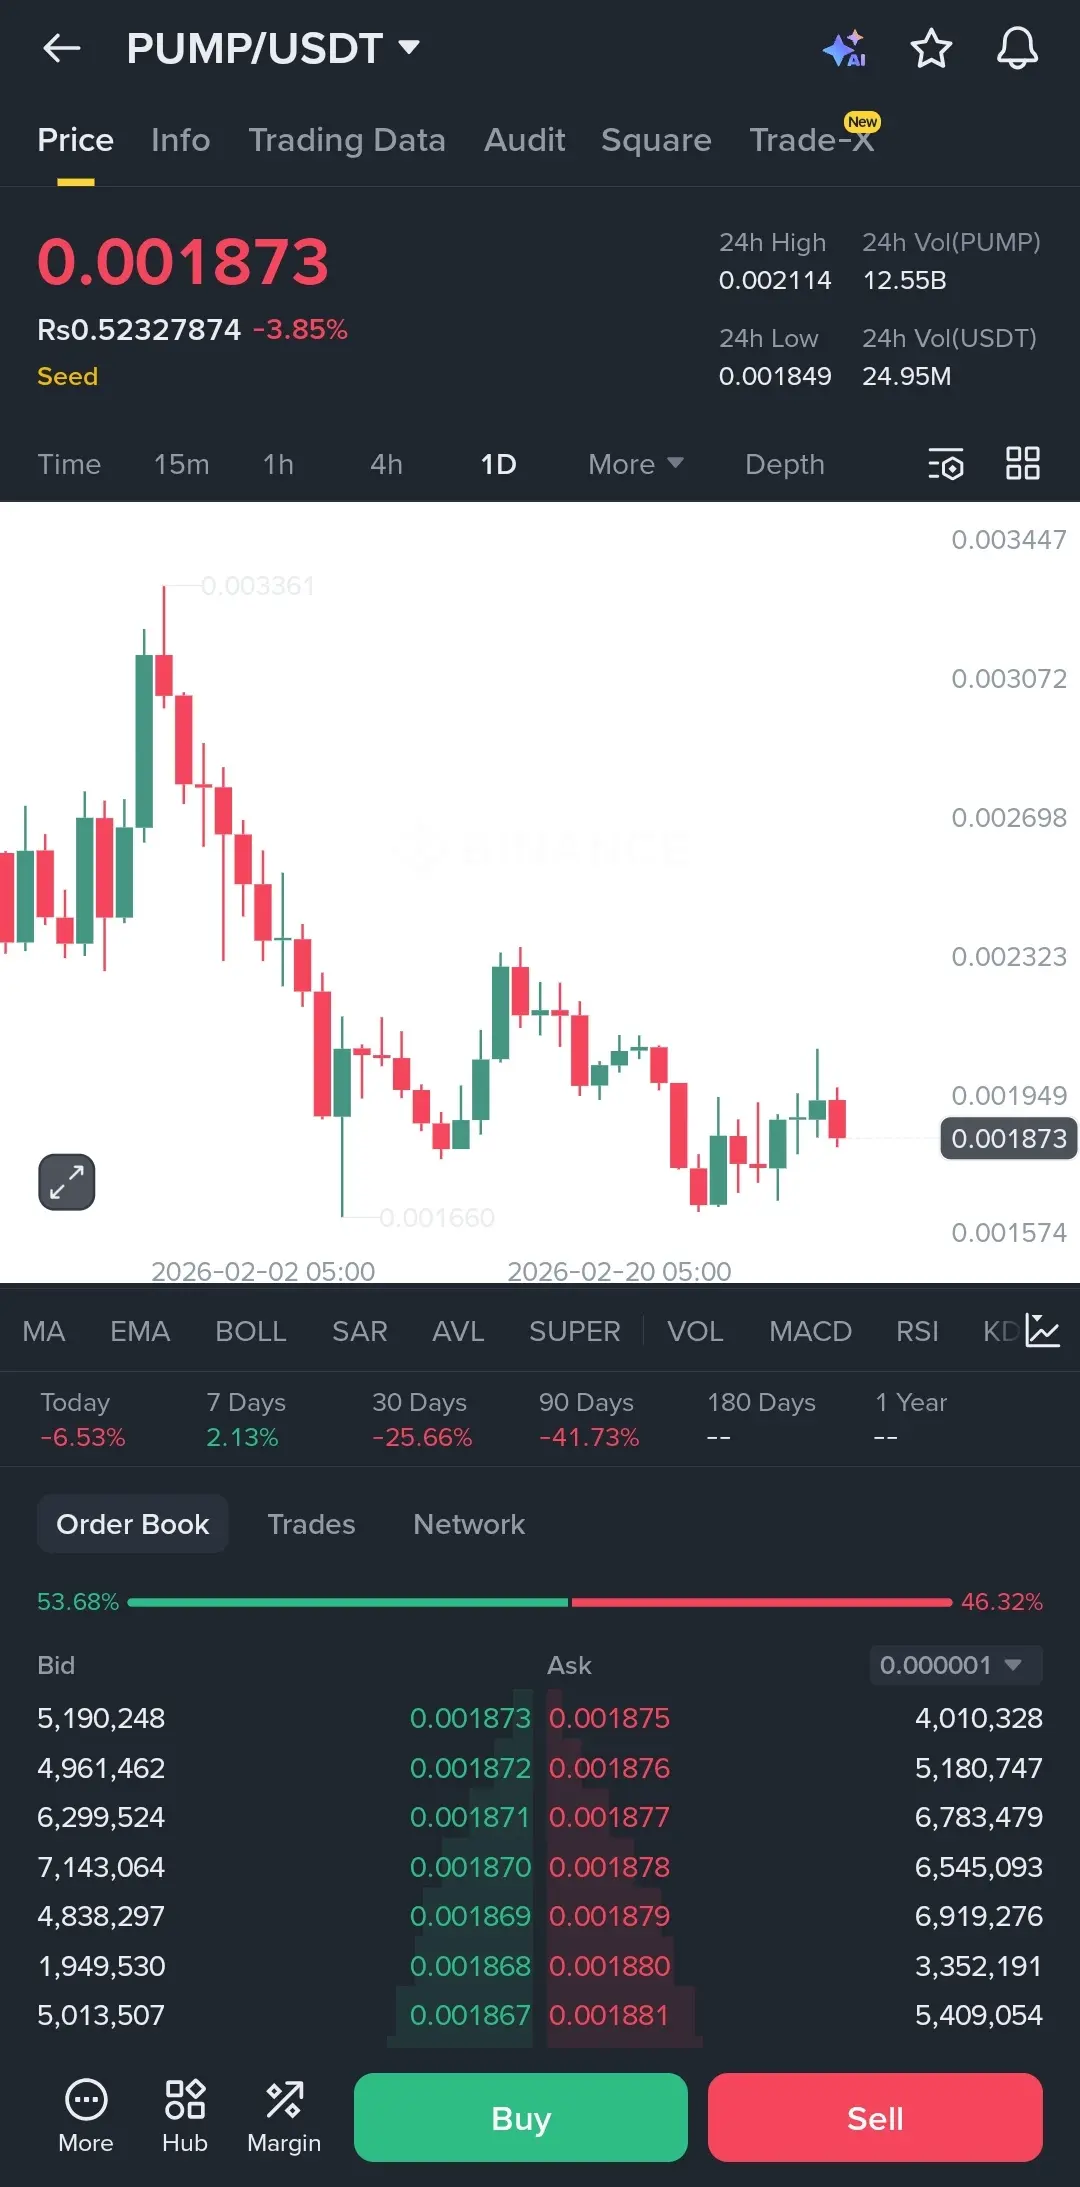
Did anyone else notice how $PUMP is quietly holding its breath?
Looking at the daily chart, we are currently at 0.001873 and it's looking a bit heavy. We’ve been rejecting that 0.0021 area for a while now and the price action is basically just bleeding slowly.
The support around 0.001660 is the only thing keeping this from a total meltdown. If that local low breaks, we are going to see a much deeper correction.
Volume is sitting around 24.95M USDT, which isn't terrible, but there’s clearly no aggressive buying yet. The order book is slightly tilted toward the bids at 53%, but it’s mostly j
PUMP11,01%

- Reward
- like
- Comment
- Repost
- Share
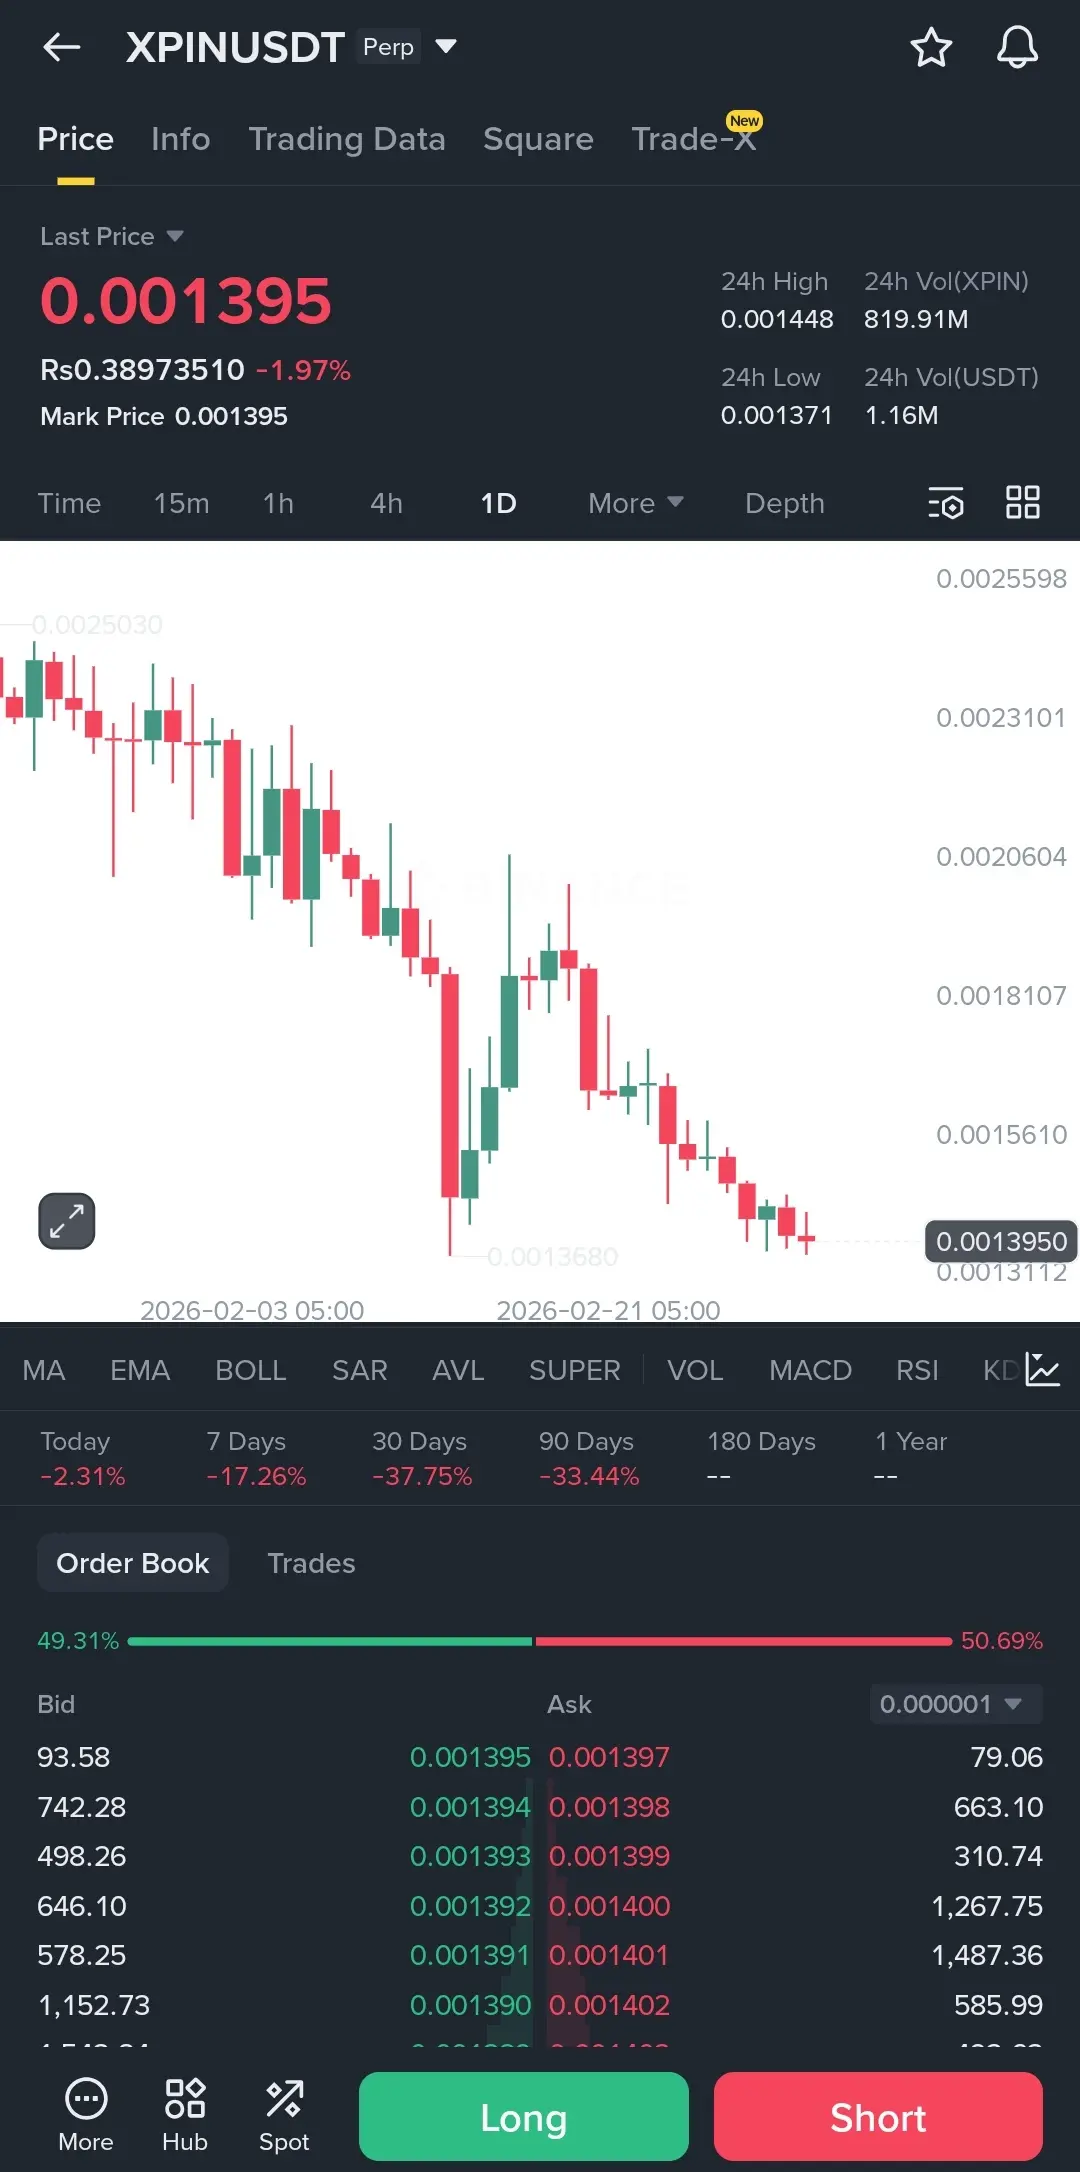
Is $XPIN actually trying to find a bottom here or is this just another trap?
The chart looks pretty painful to be honest. We’ve been in a straight downtrend and just hit 0.001395. Every time we try to bounce, the sellers just lean on it harder.
We are currently sitting right on top of the 24h low of 0.001371. If that level snaps, there isn't much historical support to catch us for a while. It’s basically a price discovery to the downside.
Volume is around 1.16M USDT which isn't exactly a massive institutional buy signal. The order book is basically a 50/50 split right now, so no one really
XPIN1,74%
- Reward
- 1
- Comment
- Repost
- Share
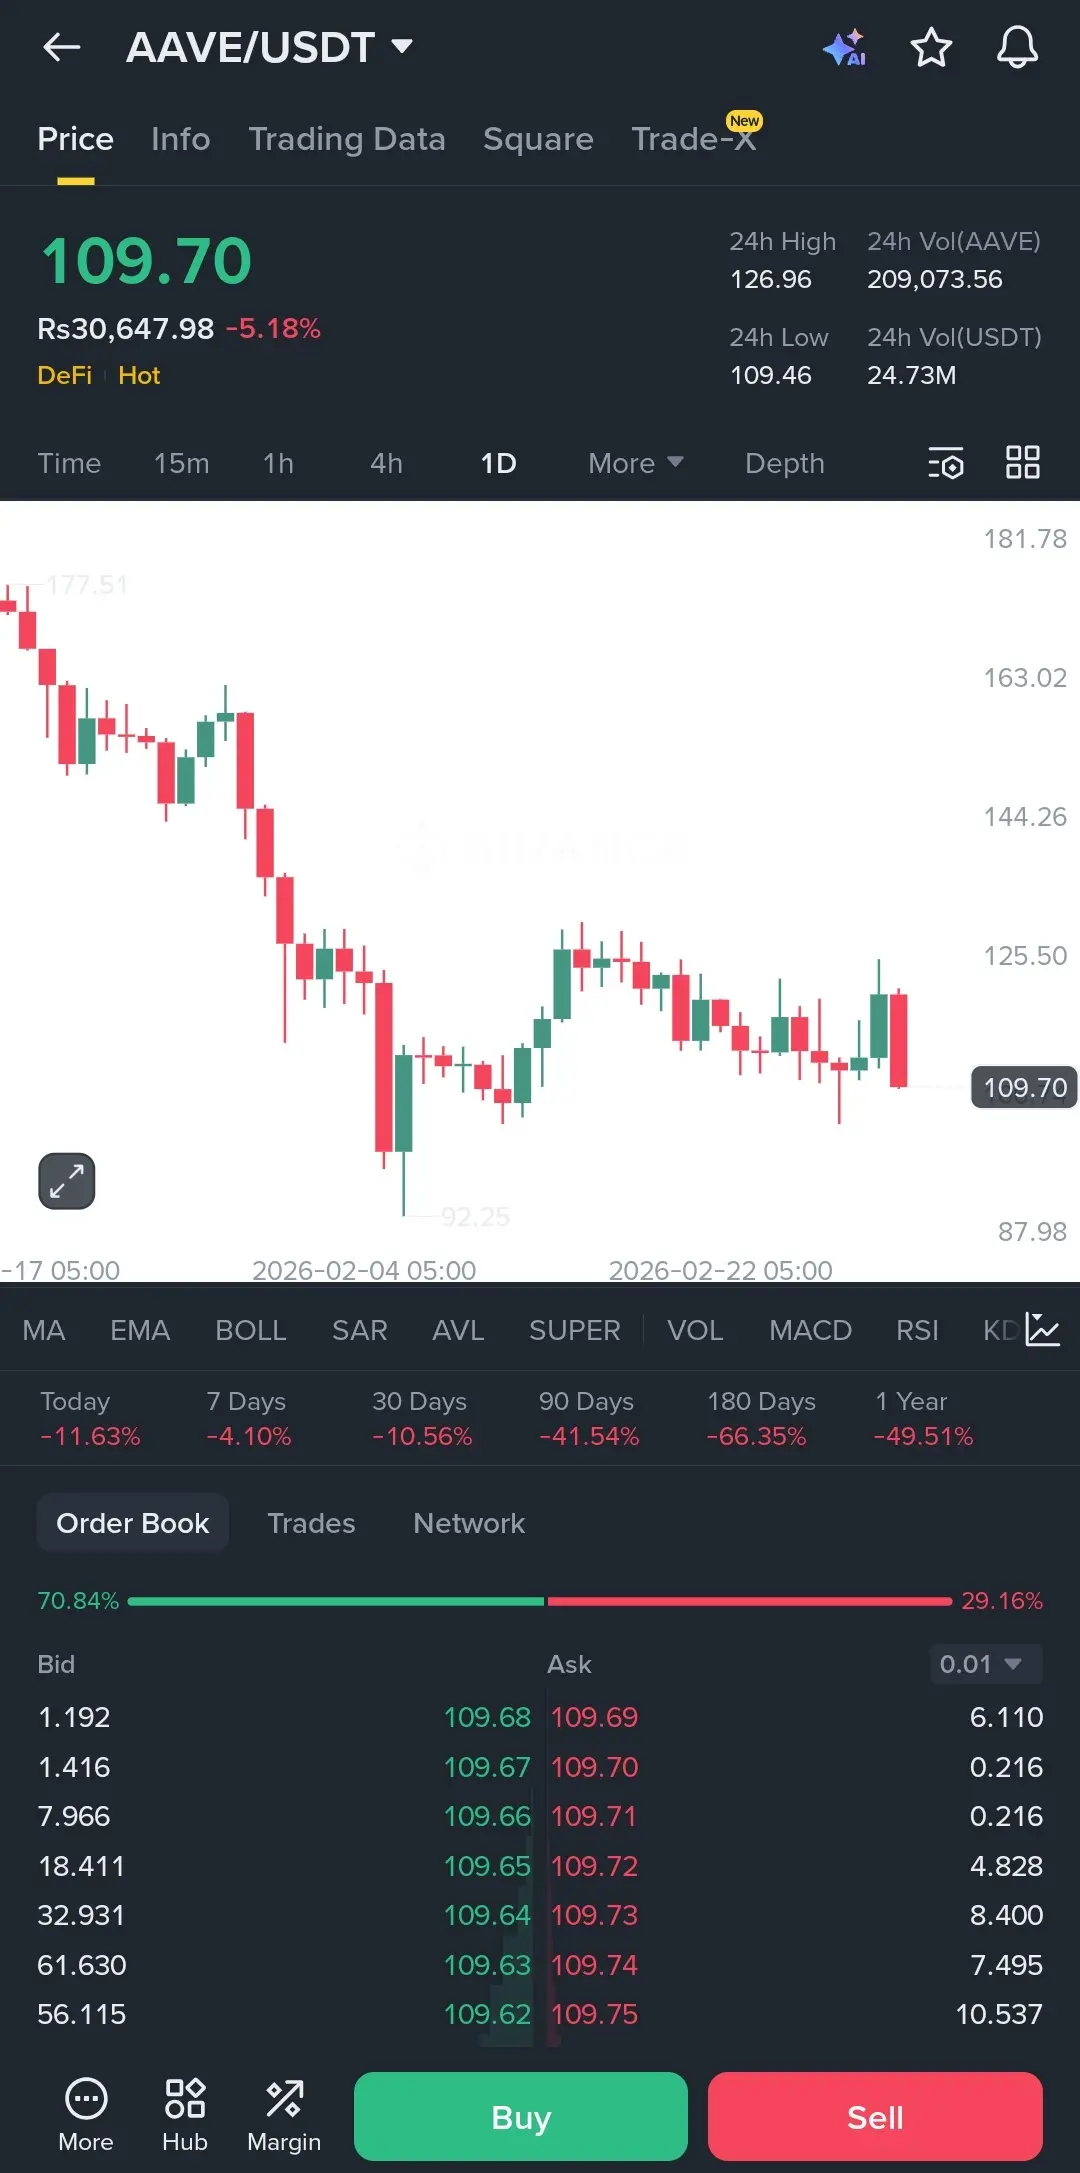
Wait, is $AAVE actually going to let us down this easily?
I'm looking at this daily chart and it's honestly a bit of a mess. We just took a 5% hit today, dragging the price down to 109.70.
The support around 109.46 is under a lot of pressure right now. If we don't see some buyers step in soon, we might be looking at a slide back toward that 92.25 level we saw earlier in February.
Volume is hovering around 24M which isn't huge, but the 70% buy orders in the book suggest people are trying to catch the bottom here.
I’m staying cautious. Unless we can reclaim 125 quickly, this feels like it wa
AAVE6,87%

- Reward
- like
- Comment
- Repost
- Share
Is this a dead cat bounce or are we finally bottoming out on $AIA ?
Seriously look at the daily chart. This thing has been getting hammered for weeks now. We are sitting way down at 0.08384 which is almost 80% off the highs.
The selling pressure seems to be drying up a bit because the candles are getting smaller but there is zero buy volume coming in to save it. We are just bleeding slowly.
If it breaks below this 0.08288 support then it is probably game over for a while. I need to see a solid daily close above 0.092 before I even think about touching a long here.
Right now it is just a fal
AIA2,12%

- Reward
- 2
- Comment
- Repost
- Share
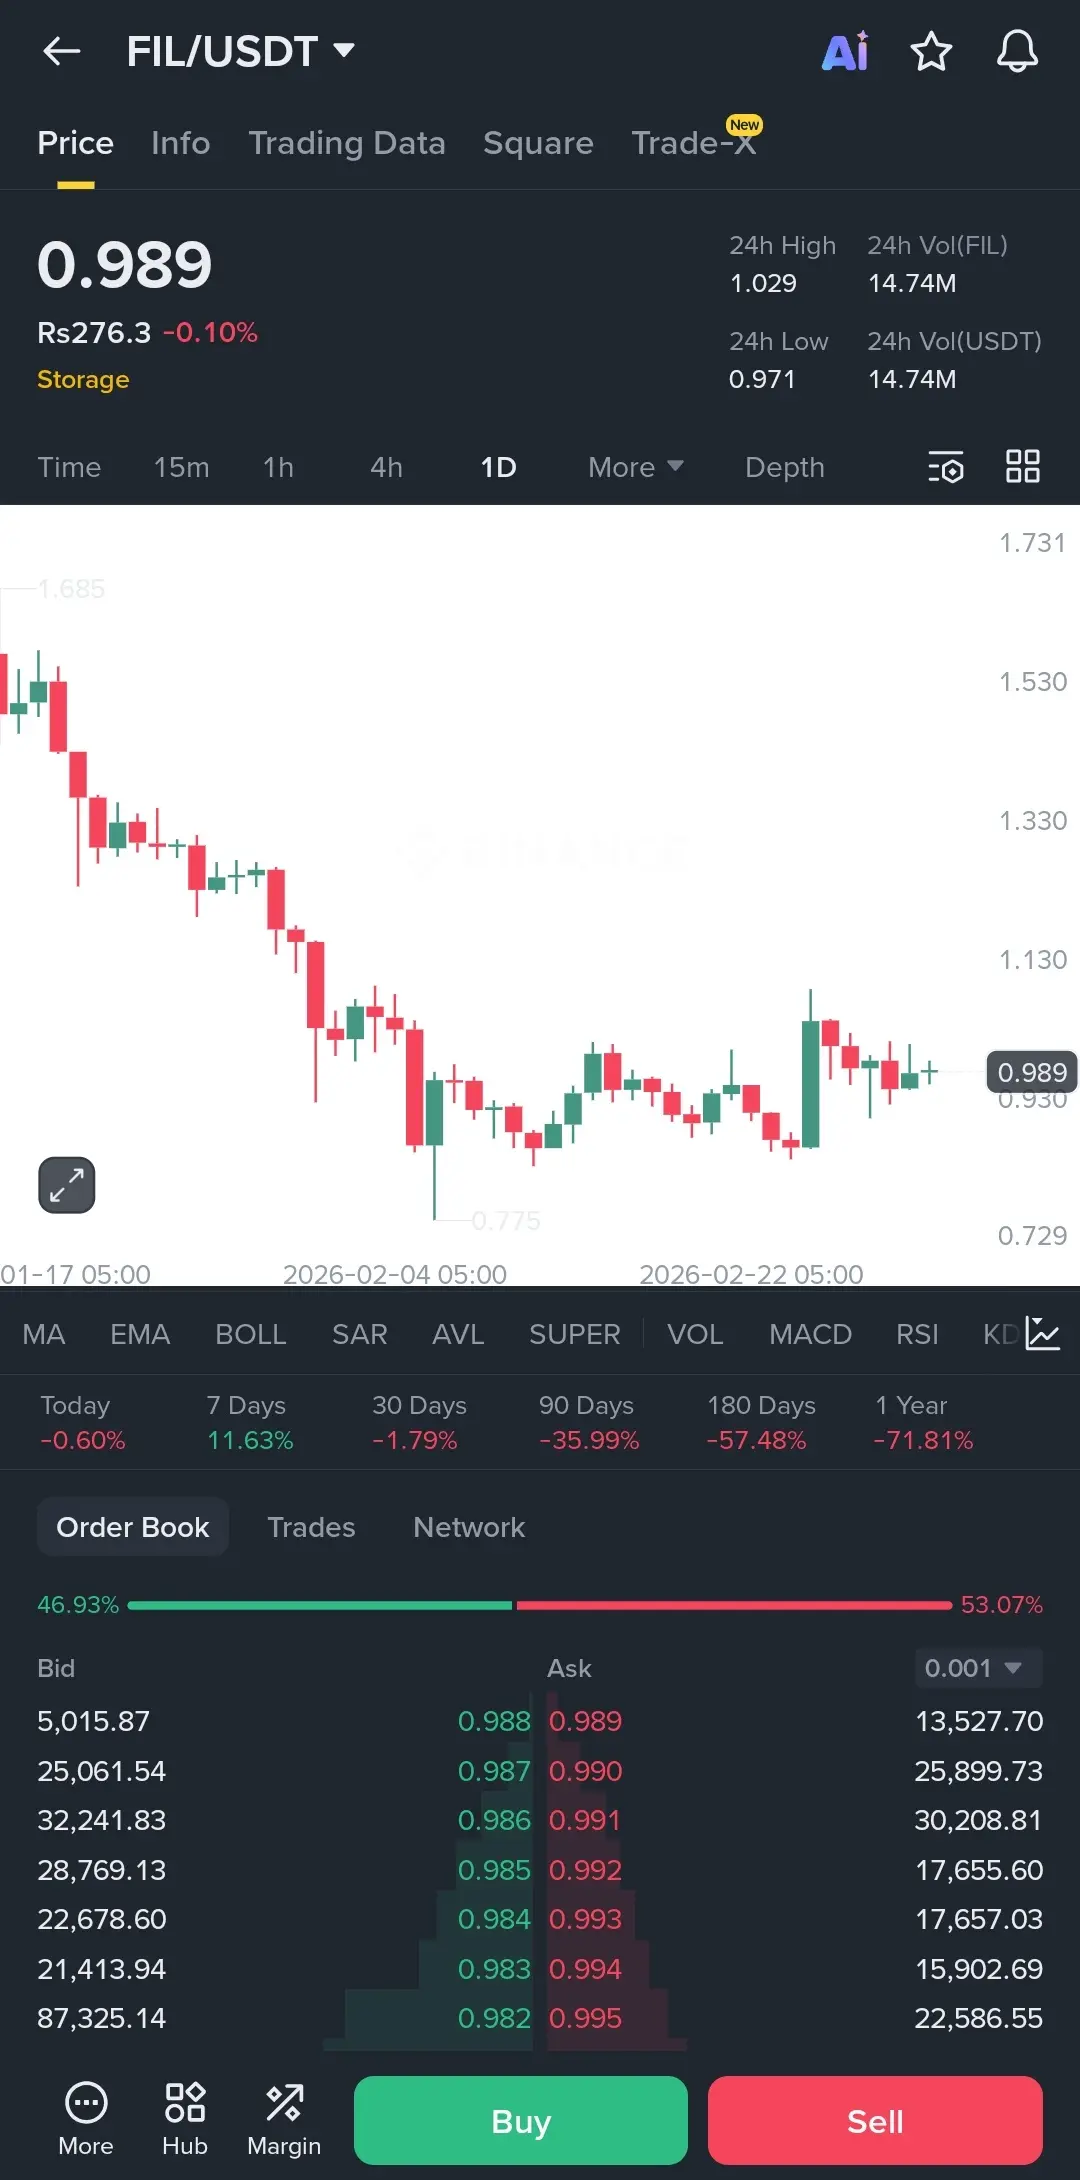
Look at the $FIL man... everybody stopped talking about it and that’s usually when things get interesting.
It’s been a rough ride down from the 1.70s but look at how it’s crawling sideways now. We finally found some floors around 0.930 after that nasty dip.
The volume is pretty mid right now so don't expect a moon mission today. We are basically stuck in a tight range.
If it can actually hold this level and clear 1.03, we might see a decent relief rally. But if it loses 0.971, we're probably heading back to test those February lows.
Just watching for a breakout of this chop for now.
#GateL
FIL3,46%

- Reward
- 1
- Comment
- Repost
- Share
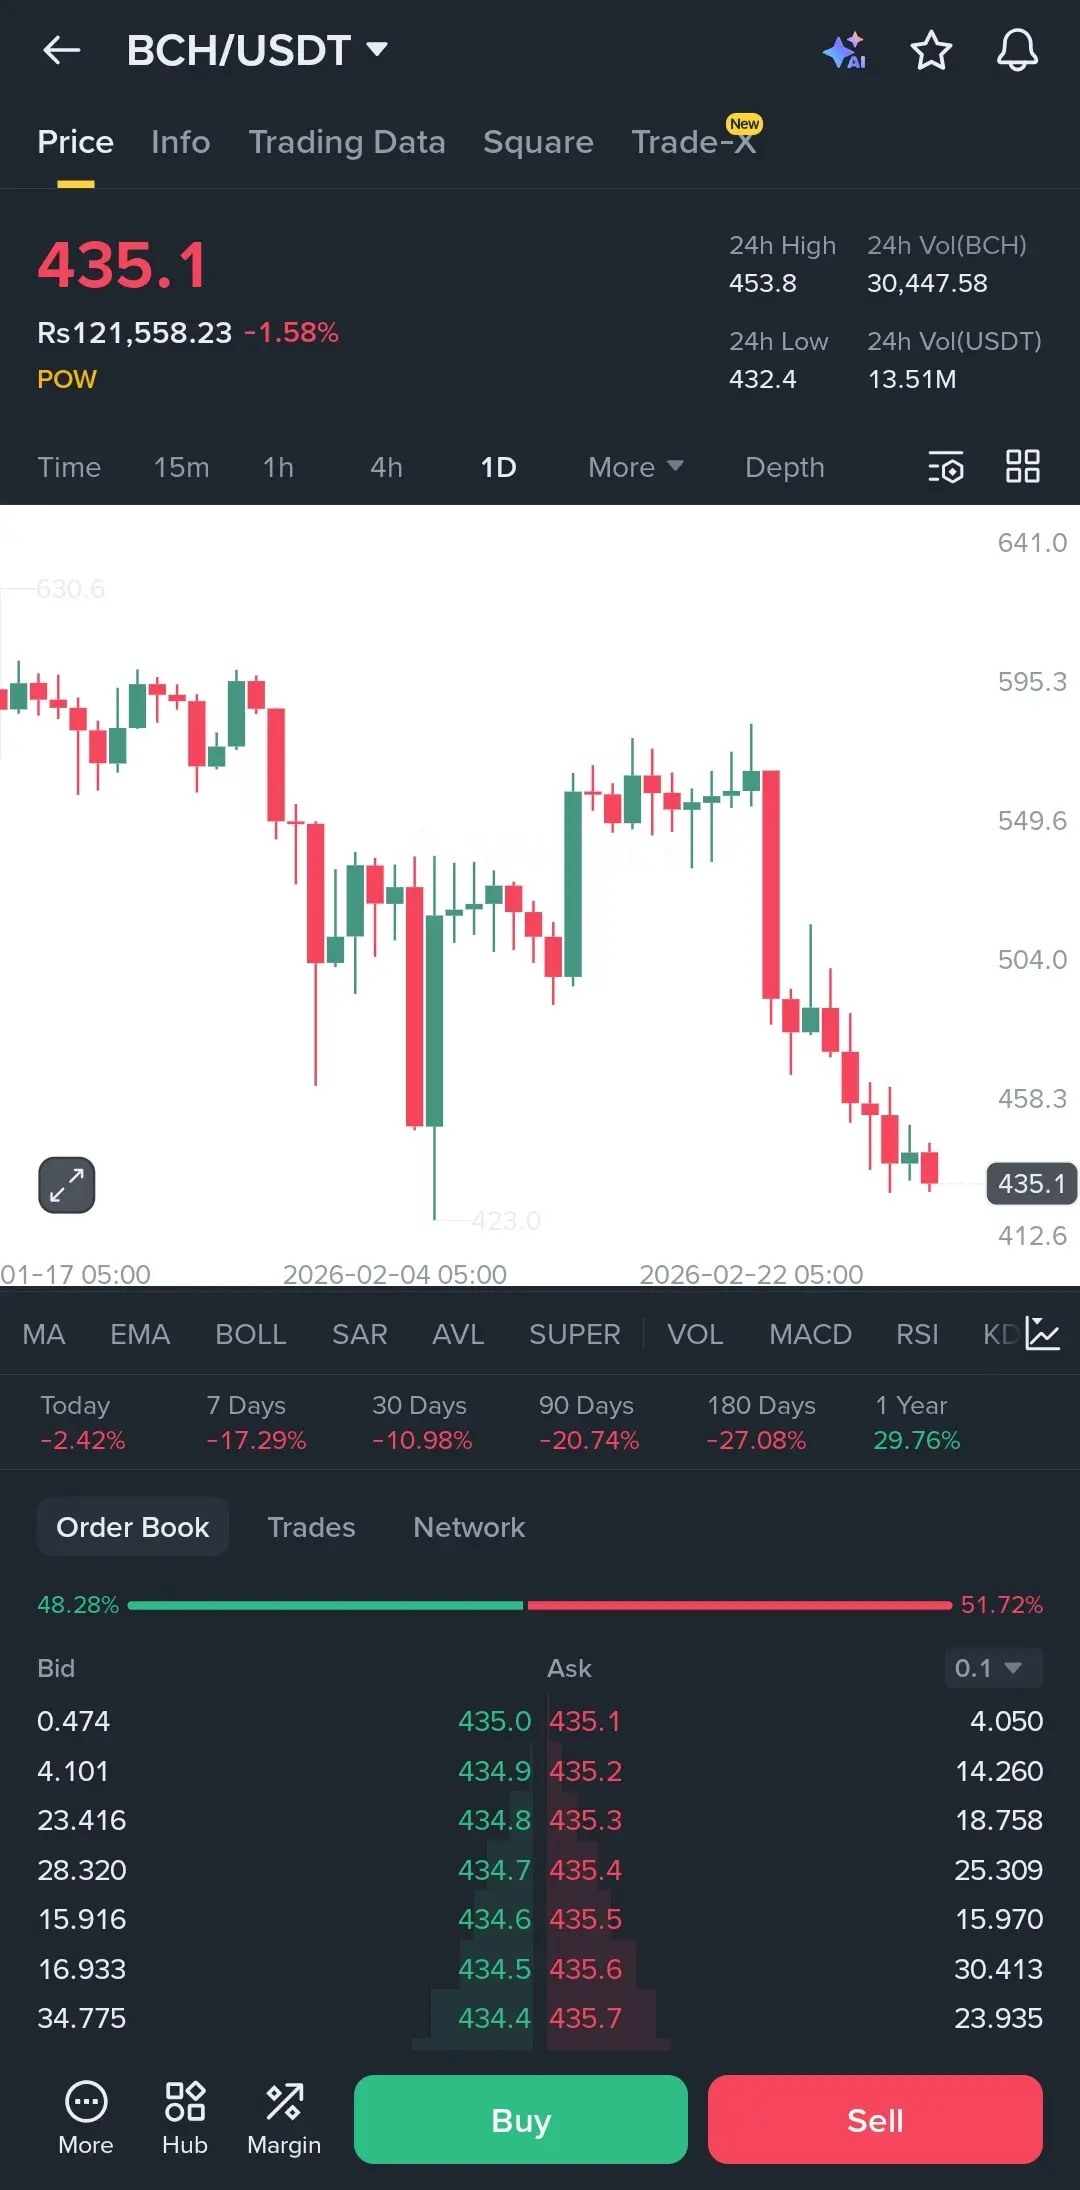
Has anyone else noticed that $BCH is starting to look a little too quiet right now?
We just came off a pretty aggressive slide from those $550 highs and the price is currently sitting at $435.1. It feels like the sellers are finally running out of steam but the buyers aren't exactly rushing in yet either.
The $423 level is the main one I'm watching. We wicked down there recently and it held, but if we drop back to test it a third time, it might not be as strong. On the flip side, we have some local resistance building up around $458.
Volume is on the lower side today. Usually, when BCH get
BCH7,2%

- Reward
- 1
- Comment
- Repost
- Share
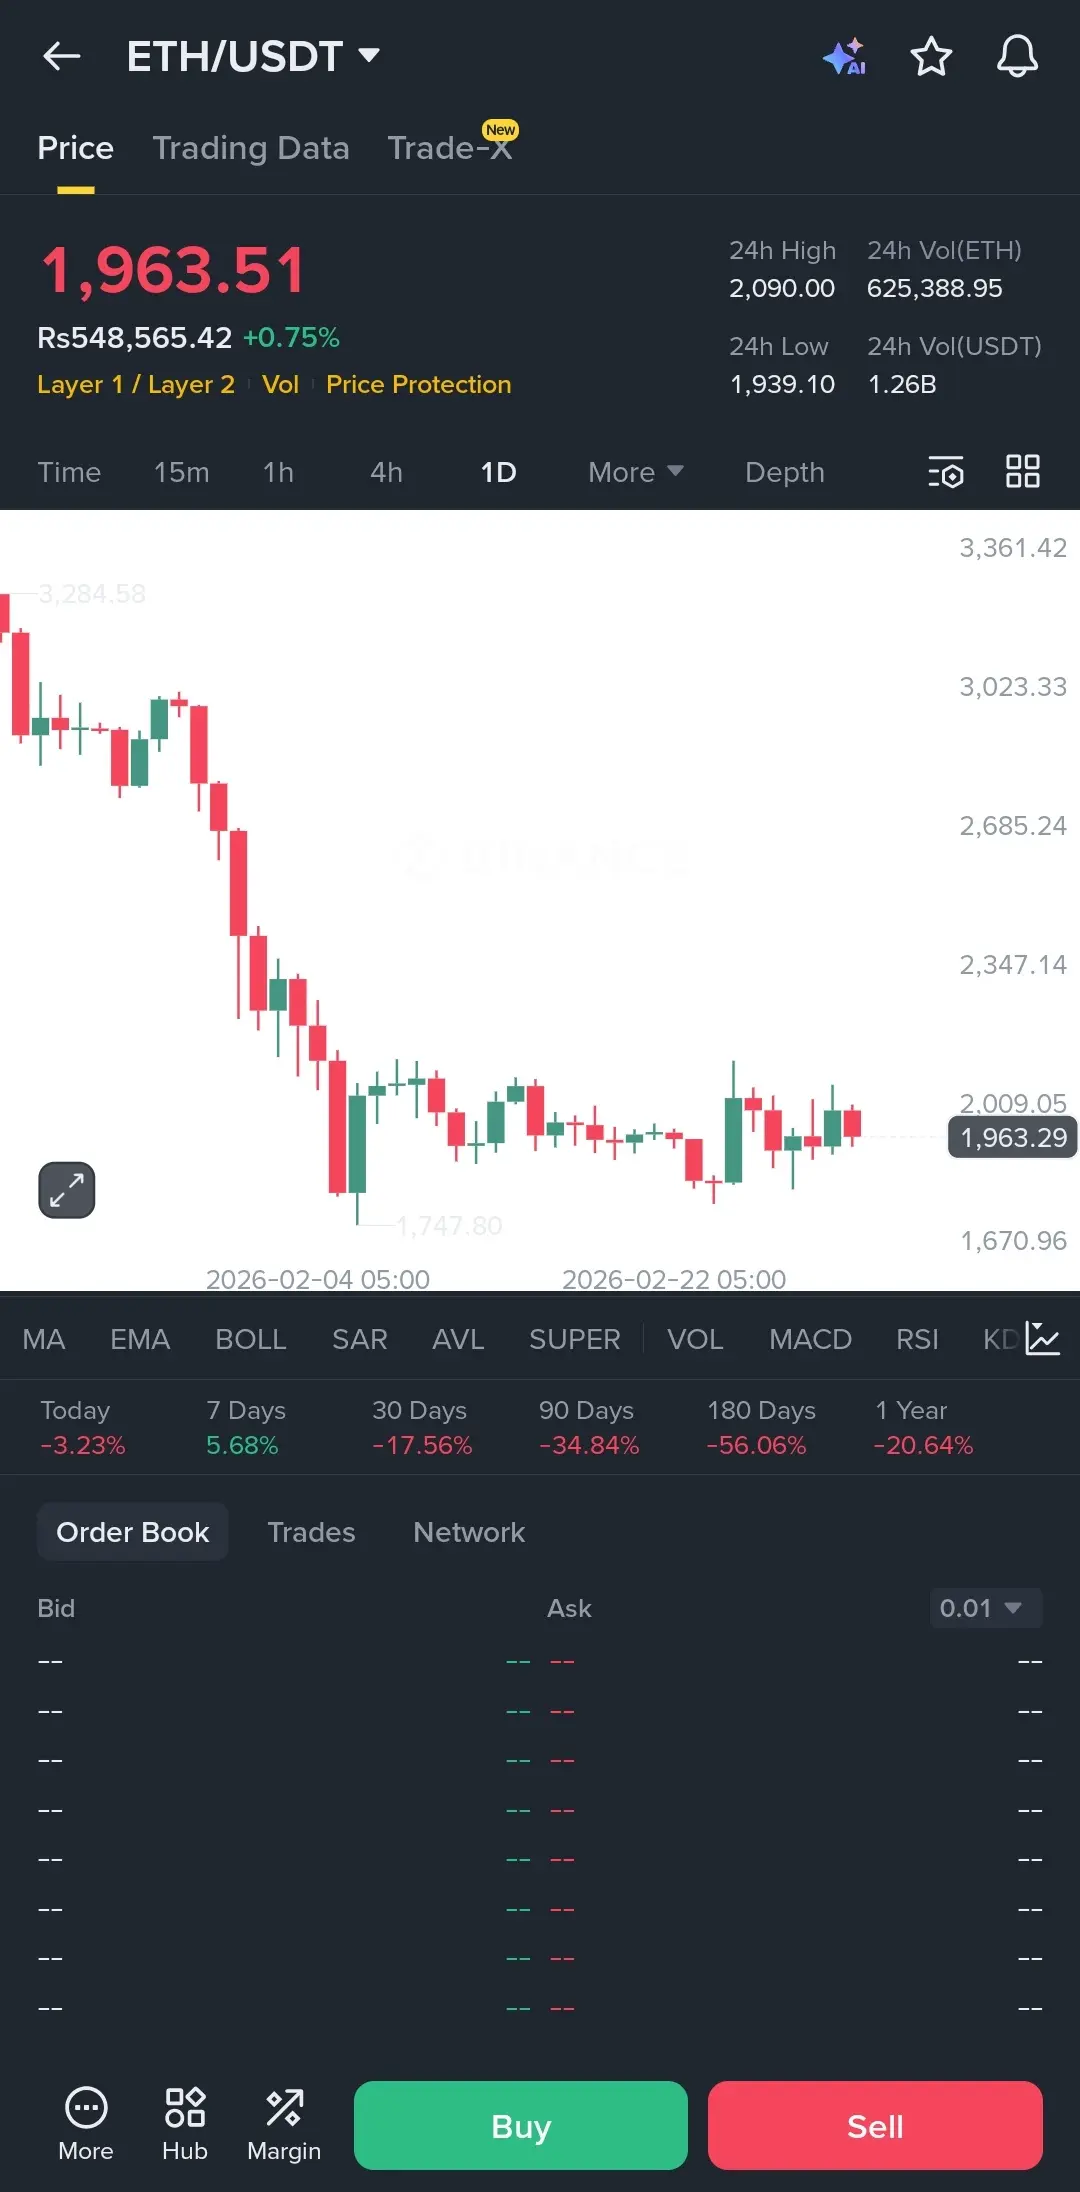
It is getting harder to ignore what $ETH is doing right now.
Price is basically hugging that $1,960 range after a pretty nasty slide from the $3,000s. We finally found some floors near $1,747, but every attempt to bounce gets shut down before it even hits $2,100.
The daily candles are looking small and indecisive. Usually, when things get this quiet after a big drop, it means the market is building up energy for the next leg. Volume is okay, but we really need a solid close above $2,000 to even think about a reversal.
If we lose that local support at $1,939, things could get slippery again
ETH9,06%

- Reward
- like
- Comment
- Repost
- Share
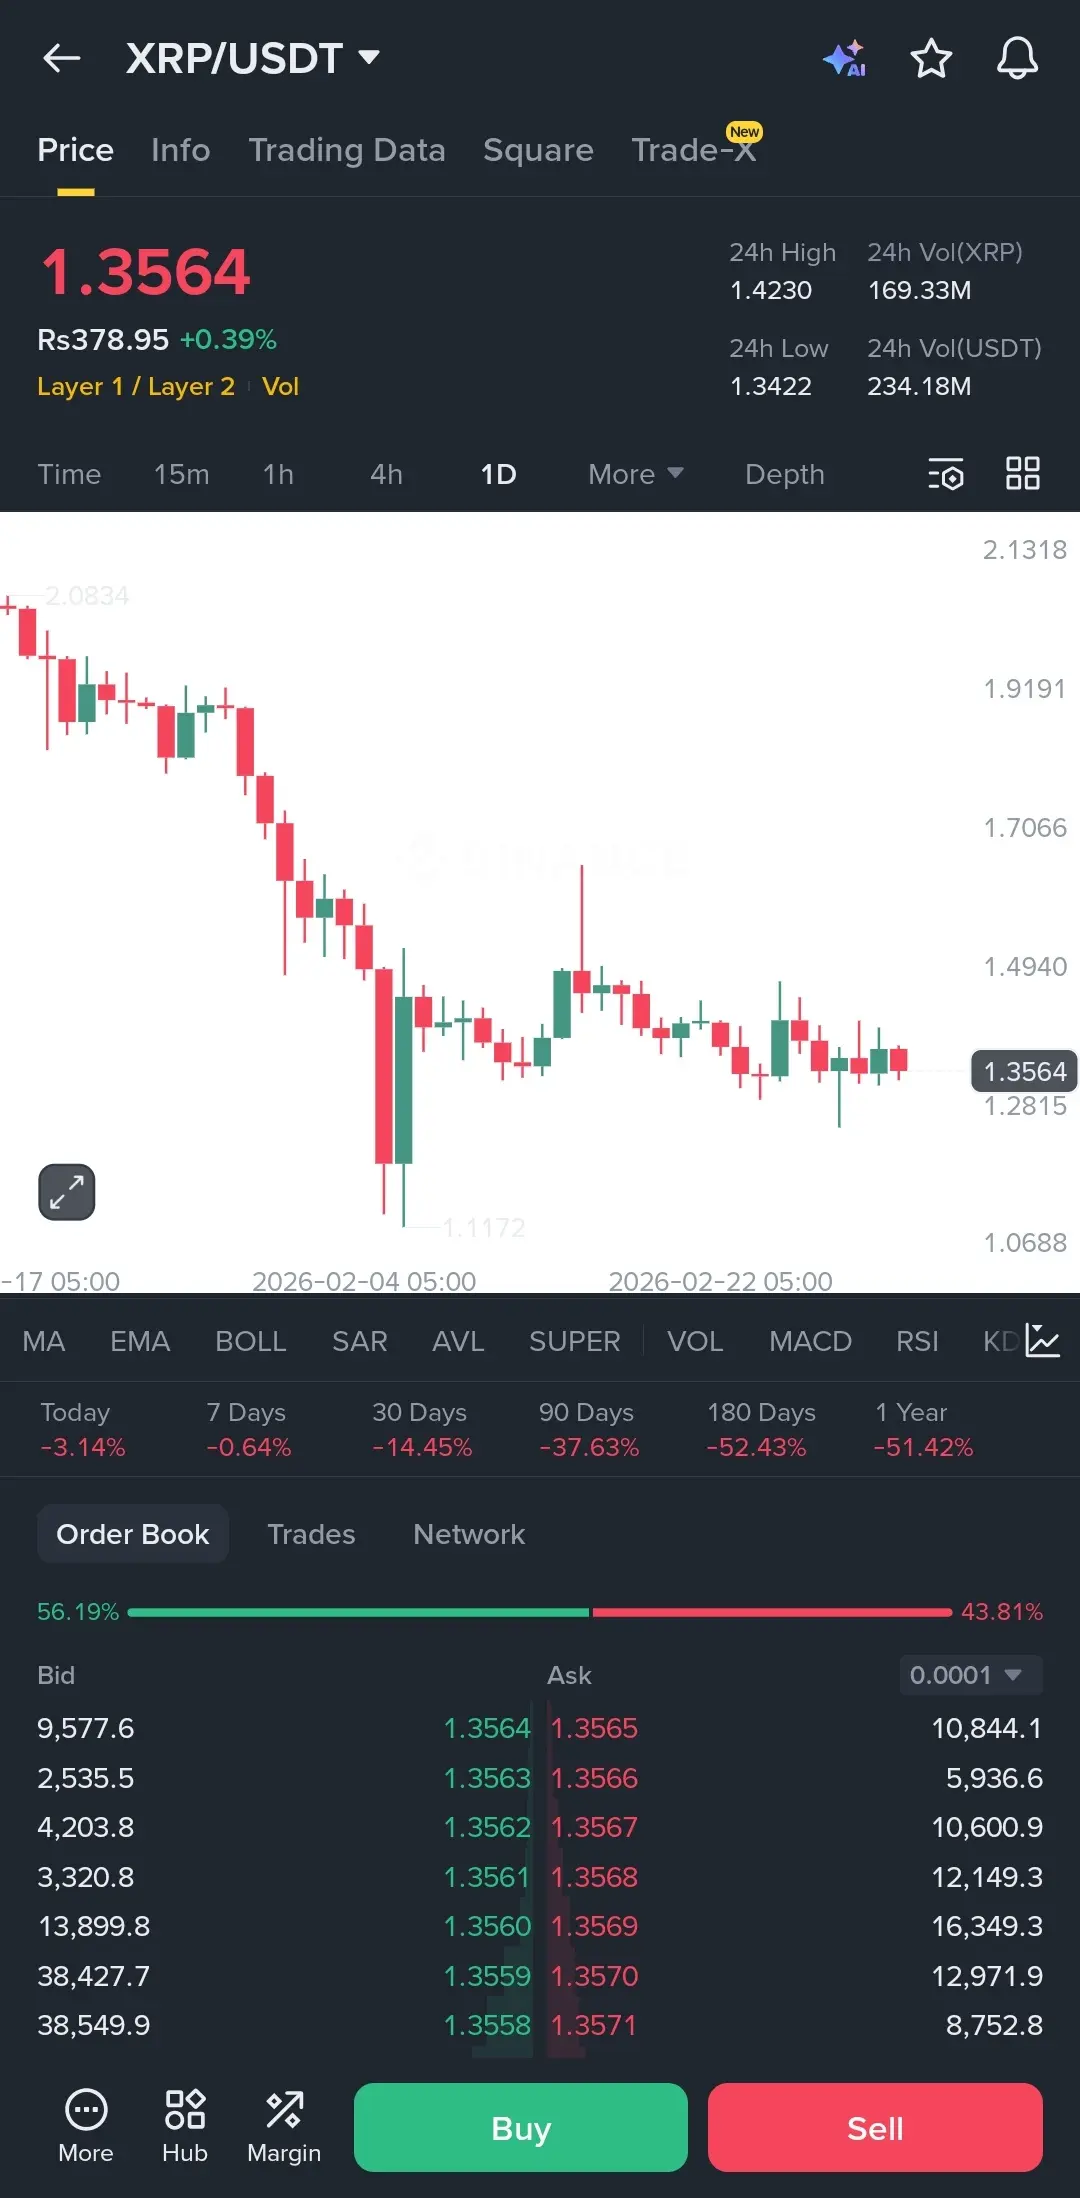
Something is definitely brewing with $XRP and most people are looking the wrong way.
We’ve been stuck in this boring sideways range for a while now after that massive drop from the 2.00s. Right now we are sitting at 1.3564 and it feels like the chart is just catching its breath.
Support at 1.28 is holding for now but every time we try to push up we get rejected. There is a clear ceiling near 1.49 that we need to break if we want to see any real action.
Volume is starting to dry up on this daily timeframe. In my experience that usually leads to a violent move one way or the other very soon.
XRP7,13%

- Reward
- like
- Comment
- Repost
- Share