#ZORA Dip is a Technical Dumb
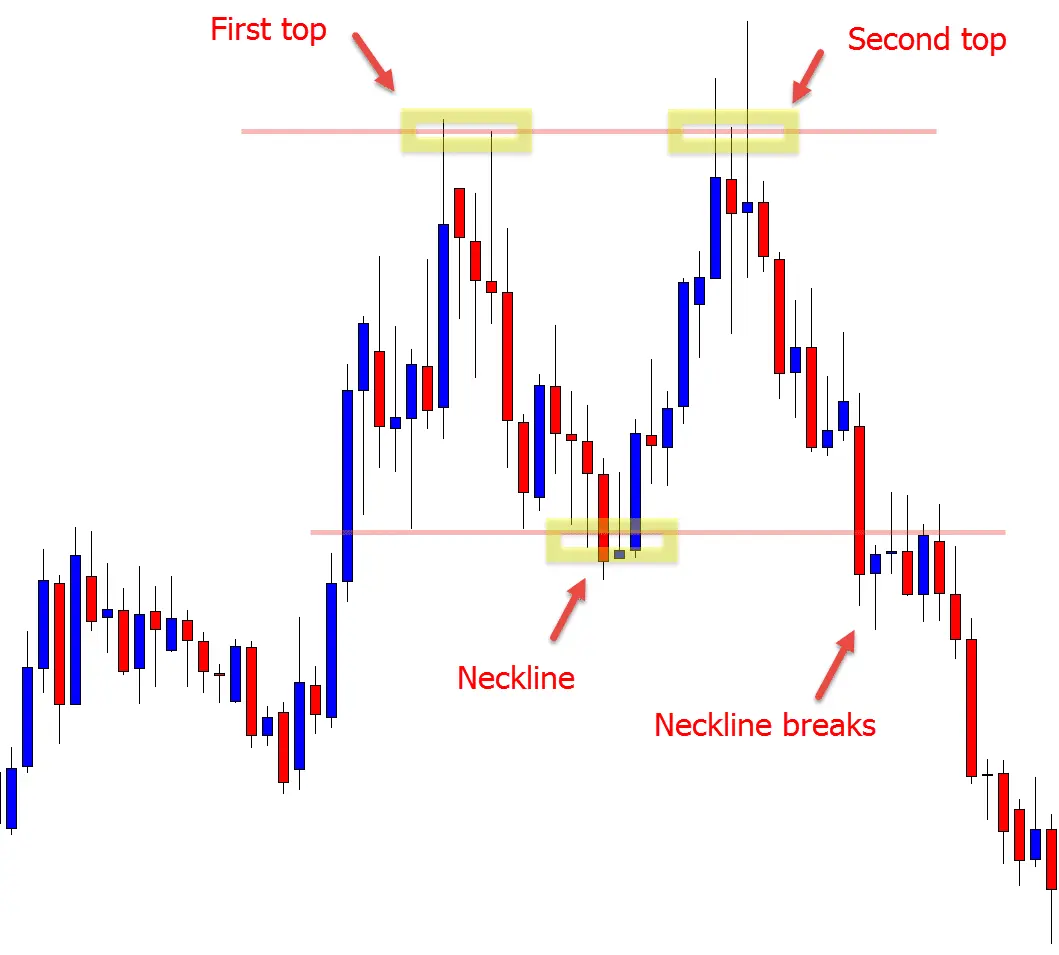
A double top is a bearish reversal chart pattern shaped like the letter "M," occurring after an uptrend when the price fails to surpass a resistance level twice, forming two consecutive peaks. The pattern is confirmed when the price falls below the "neckline," a support level at the low point between the two peaks. This break signals weakening buying momentum and increased selling pressure, indicating a likely downward trend.