Trade
Trading Type
Spot
Trade crypto freely
Alpha
Points
Get promising tokens in streamlined on-chain trading
Pre-Market
Trade new tokens before they are officially listed
Margin
Magnify your profit with leverage
Convert & Block Trading
0 Fees
Trade any size with no fees and no slippage
Leveraged Tokens
Get exposure to leveraged positions simply
Futures
Futures
Hundreds of contracts settled in USDT or BTC
Options
HOT
Trade European-style vanilla options
Unified Account
Maximize your capital efficiency
Demo Trading
Futures Kickoff
Get prepared for your futures trading
Futures Events
Participate in events to win generous rewards
Demo Trading
Use virtual funds to experience risk-free trading
Earn
Launch
CandyDrop
Collect candies to earn airdrops
Launchpool
Quick staking, earn potential new tokens
HODLer Airdrop
Hold GT and get massive airdrops for free
Launchpad
Be early to the next big token project
Alpha Points
NEW
Trade on-chain assets and enjoy airdrop rewards!
Futures Points
NEW
Earn futures points and claim airdrop rewards
Investment
Simple Earn
Earn interests with idle tokens
Auto-Invest
Auto-invest on a regular basis
Dual Investment
Buy low and sell high to take profits from price fluctuations
Soft Staking
Earn rewards with flexible staking
Crypto Loan
0 Fees
Pledge one crypto to borrow another
Lending Center
One-stop lending hub
VIP Wealth Hub
Customized wealth management empowers your assets growth
Private Wealth Management
Customized asset management to grow your digital assets
Quant Fund
Top asset management team helps you profit without hassle
Staking
Stake cryptos to earn in PoS products
BTC Staking
HOT
Stake BTC and earn 10% APR
GUSD Minting
Use USDT/USDC to mint GUSD for treasury-level yields

More
GasWaster69
- Reward
- like
- Comment
- Repost
- Share
BlackRock CEO Larry Fink called $BTC a "fear asset" because it's bought as a hedge against economic and geopolitical uncertainty and currency depreciation. He explained that Bitcoin differs from traditional investment instruments because it's bought based on fear. Despite this, BlackRock manages the world's largest Bitcoin ETF. Fink highlighted Bitcoin's appeal because of its limited supply, unlike fiat currencies that can be printed by governments. He also mentioned that sovereign wealth funds are starting to buy Bitcoin as a hedge. However, Fink cautioned about Bitcoin's volatility and the r
BTC0.25%
- Reward
- like
- Comment
- Repost
- Share
- Reward
- like
- Comment
- Repost
- Share
- Reward
- like
- Comment
- Repost
- Share
Strive calls on MSCI to rethink its ‘unworkable’ Bitcoin blacklist
Nasdaq-listed Strive, the 14th-largest publicly-listed Bitcoin treasury firm, has urged MSCI to reconsider its proposed exclusion of major Bitcoin holding companies from its indexes
In a letter to MSCI’s chairman and CEO, Henry Fernandez, Strive argued that excluding companies whose digital
In a letter to MSCI’s chairman and CEO, Henry Fernandez, Strive argued that excluding companies whose digital
BTC0.25%
- Reward
- like
- Comment
- Repost
- Share
- Reward
- like
- Comment
- Repost
- Share
Ethereum stands above $3,140! Quant trading giant bets $105 million on ETH
North Carolina-based Antithesis has raised $105 million in a Series A funding round led by Wall Street quantitative trading giant Jane Street. Antithesis helps Ethereum ensure smooth upgrades during its transition to the Proof-of-Stake (PoS) consensus protocol through advanced simulation and stress testing. Ethereum has surpassed $3,140, with trading volume remaining at a high of $31 billion.
ETH0.67%
- Reward
- like
- 1
- Repost
- Share
Marif1724 :
:
best for it's support lavel#我的币圈搞笑瞬间
Gate Plaza is the community corner of Gate, designed to bring traders together through creativity, humor, and shared experiences. In a market that can often feel intense and unpredictable, Gate Plaza offers a refreshing space where users can relax, express themselves, and enjoy lighter moments of crypto life. From funny trading stories to relatable market mishaps, it’s a place where the community connects through genuine moments and earns rewards along the way. Whether you’re a seasoned trader or a newcomer, Gate Plaza turns your crypto adventures even the chaotic ones into opportun
Gate Plaza is the community corner of Gate, designed to bring traders together through creativity, humor, and shared experiences. In a market that can often feel intense and unpredictable, Gate Plaza offers a refreshing space where users can relax, express themselves, and enjoy lighter moments of crypto life. From funny trading stories to relatable market mishaps, it’s a place where the community connects through genuine moments and earns rewards along the way. Whether you’re a seasoned trader or a newcomer, Gate Plaza turns your crypto adventures even the chaotic ones into opportun

- Reward
- 4
- 6
- Repost
- Share
UQueen :
:
2025 GOGOGO 👊View More
- Reward
- like
- Comment
- Repost
- Share
$FARTCOIN
ANALYSIS
**Time Range**: 2025-12-05 00:45:00 ~ 2025-12-05 01:12:00
**Data Nature**: Real-time Candlesticks
Candlestick Pattern Deep Analysis
1. **Early session shows a strong bearish engulfing pattern around 0.3865** - Previous uptrend rejection - Strong bearish signal
2. **Multiple red candles with long bodies form after the initial drop** - Sustained selling pressure - Medium bearish signal
3. **Double bottom formation at 0.3780 level** - Potential reversal zone - Strong bullish signal
4. **Large green candle appears near 19:03 showing strong buying momentum** - Bullish breakou
FARTCOIN3.68%
- Reward
- like
- Comment
- Repost
- Share
🎢 SOL Analysis – Excitement at Its Peak! (December 5, 2025)
The price is at $136.89, moving between $143.69 – $136.3 😱.
🚀 Upside: If SOL holds the $138–140 support, it could soar towards $146–150, and if momentum increases, even $155–159! 🌟✨
⚡ Downside: Breaking the $138–140 support could push it to $130–135, or possibly $122–126 ⚠️
🎯 Summary:
For risk-takers: Watch the support and enter on the bounce 🏹
For long-term investors: Wait for a close above $150 ⏳
💥 SOL today is between a rock and a hard place! Will it go up or down? 🔥📈
SOL-0.09%
- Reward
- 24
- 12
- Repost
- Share
PrincessQingyue:
"默默无闻" in English is "unknown" or "obscure" or "unassuming." "默默" in English is "silently," "quietly," or "without fanfare."
If you are asking how to say "默默" in English, it's "silently" or "quietly."
View More
Malaysia loses $1.1 billion! Drones hunt down illegal Bitcoin mining electricity theft syndicates
According to Bloomberg, Malaysia is using drones, handheld sensors, and resident complaints to track illegal Bitcoin mining operations. These miners steal electricity, causing the state-owned energy company Tenaga Nasional Berhad (TNB) to suffer losses of about $1.1 billion. Over the past five years, authorities have uncovered around 14,000 illegal mining sites. Since Bitcoin prices hit an all-time high in October, about 3,000 electricity theft cases related to Bitcoin mining have been recorded.
- Reward
- like
- Comment
- Repost
- Share
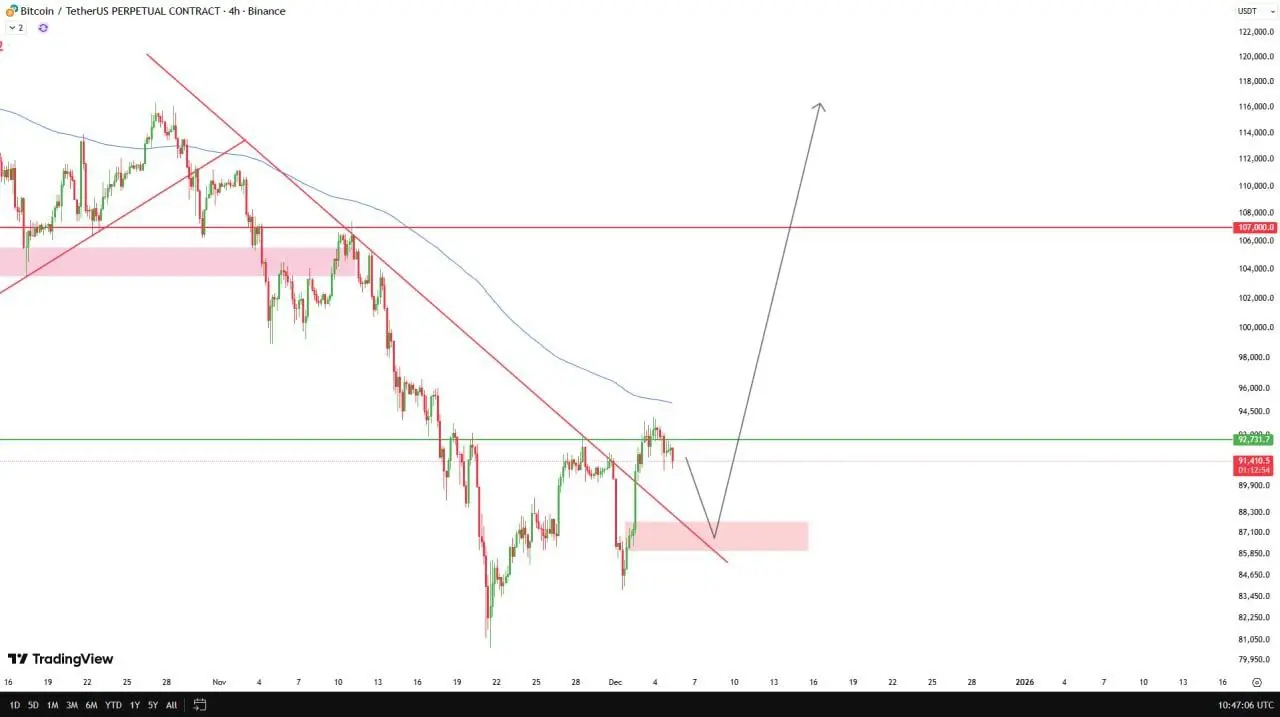
$BTC just flipped the script in explosive fashion.
The downward trendline is gone and the chart is finally breathing upward again.
I’m watching how the candles are pulling back slowly and it feels like the market is gathering strength for the next push.
If this correction stays clean, the rebound can hit hard because they’re protecting every new higher low with confidence.
We’re seeing momentum shifting step by step and the setup is turning into a classic breakout continuation play. This kind of structure usually fuels another strong leg up once the pullback completes.
BTC looks ready for
BTC0.25%
- Reward
- like
- Comment
- Repost
- Share
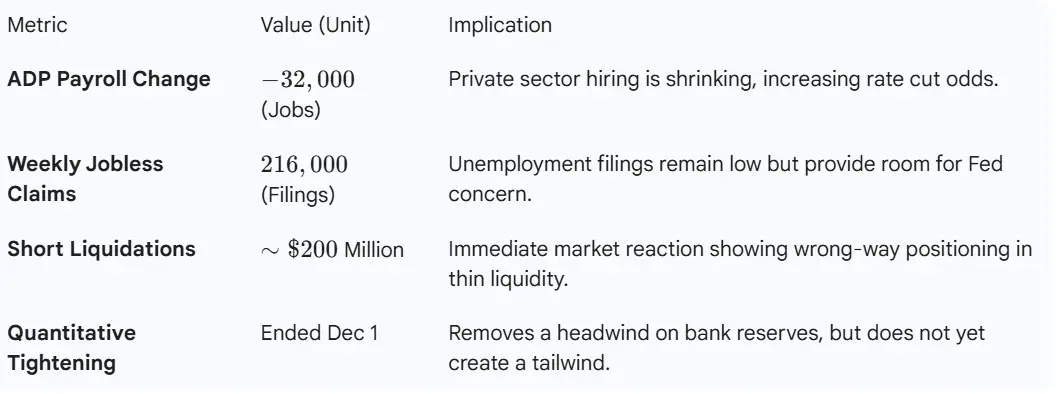
🚨 LIQUIDITY DRAINING????
Soft labor data is easing pressure: ADP -32K jobs, Jobless Claims 216K.
Short liquidations ~$200M show traders mispositioned, not broad inflows.
DXY weakening helps dollar-priced assets but is a normal pullback.
QT ended Dec 1, removing a headwind but not creating a tailwind.
Real liquidity wave needs rate cuts, fiscal spending, better household balance sheets, and clearer regs.
Bitcoin reacts to easing, but no flood yet. Transition phase underway.
Signals improving. Markets watching.
BTC0.25%
- Reward
- like
- Comment
- Repost
- Share
Load More
Join 40M users in our growing community
⚡️ Join 40M users in the crypto craze discussion
💬 Engage with your favorite top creators
👍 See what interests you
- Trending TopicsView More
277.18K Popularity
75.77K Popularity
11.41K Popularity
12.09K Popularity
13.37K Popularity
- Hot Gate FunView More
- MC:$3.58KHolders:10.82%
- MC:$3.5KHolders:10.00%
- MC:$3.75KHolders:20.85%
- MC:$3.6KHolders:10.81%
- MC:$3.52KHolders:10.00%
- Pin