MuxiTrading
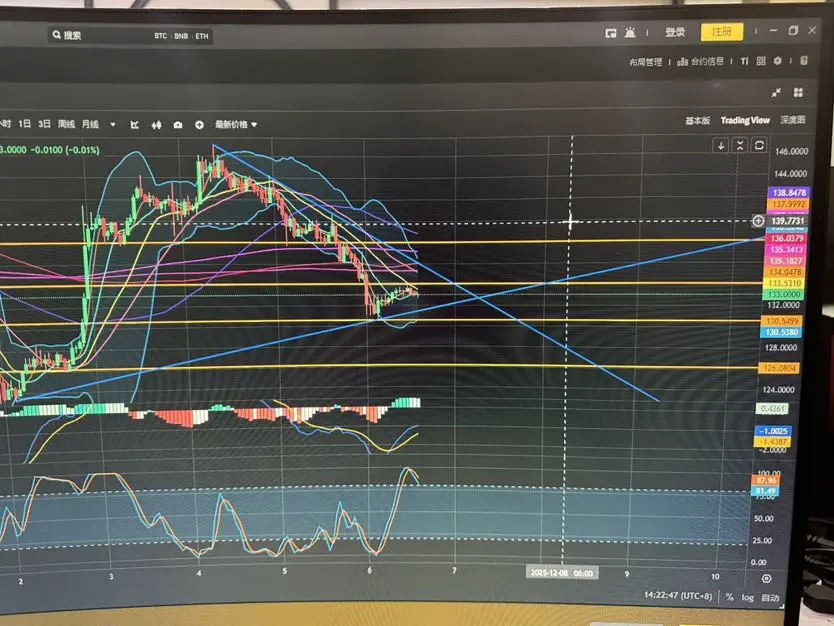
#反弹币种推荐 SOL 1-hour indicators: The Bollinger Bands are opening, corresponding to the range 136.2-129. The middle band is trending downward, corresponding to the price of 132.6, and SOL is at 132.8.
Moving average indicators:
The MA5 has crossed below the MA10 at 132.1. The 30-day moving average is trending downward at 132.6. The 60-day moving average is trending downward at 132.7, the 120-day moving average is trending downward at 137, the 240-day moving average is trending upward at 135.6, and the 360-day moving average is flat at 136.
MACD: Above the 0 axis. The fast line is above the slow l
SOL1.7%