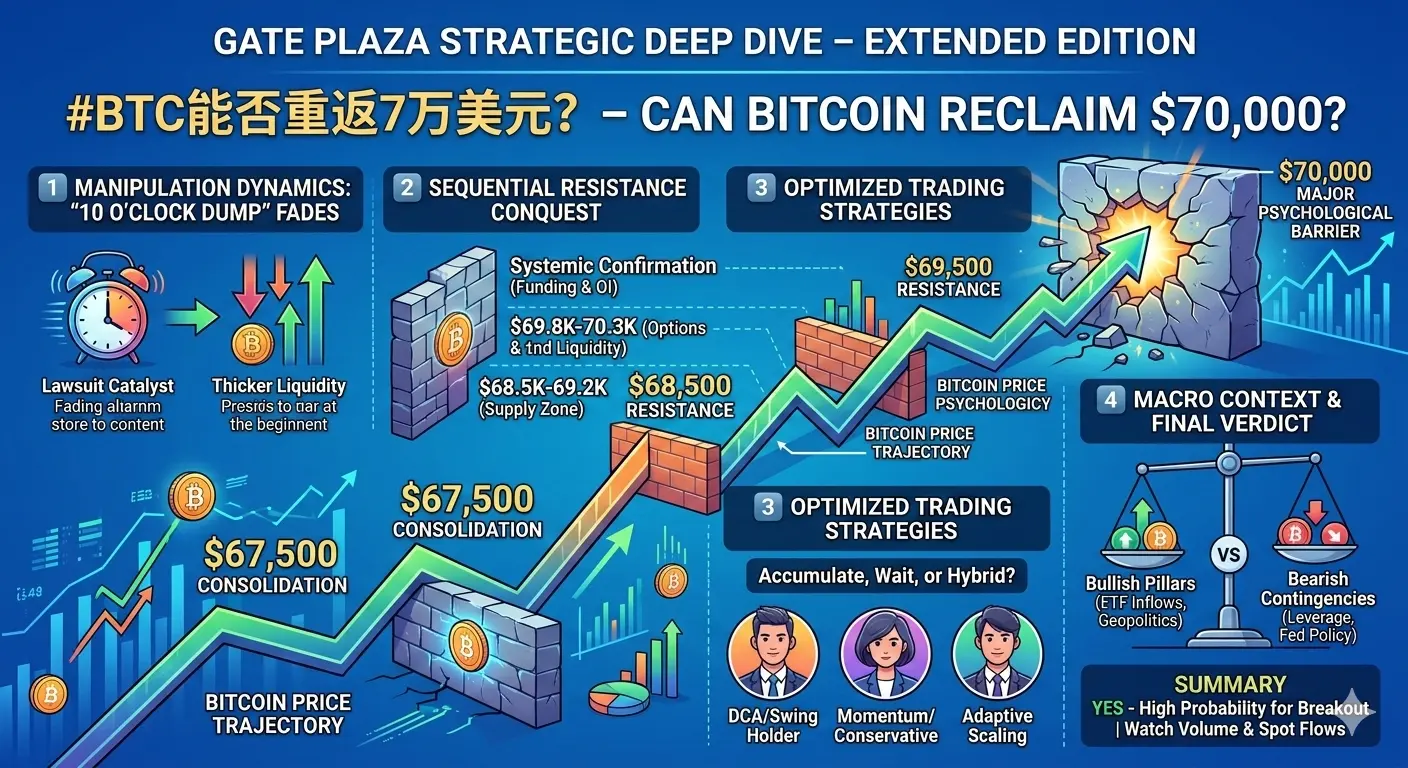
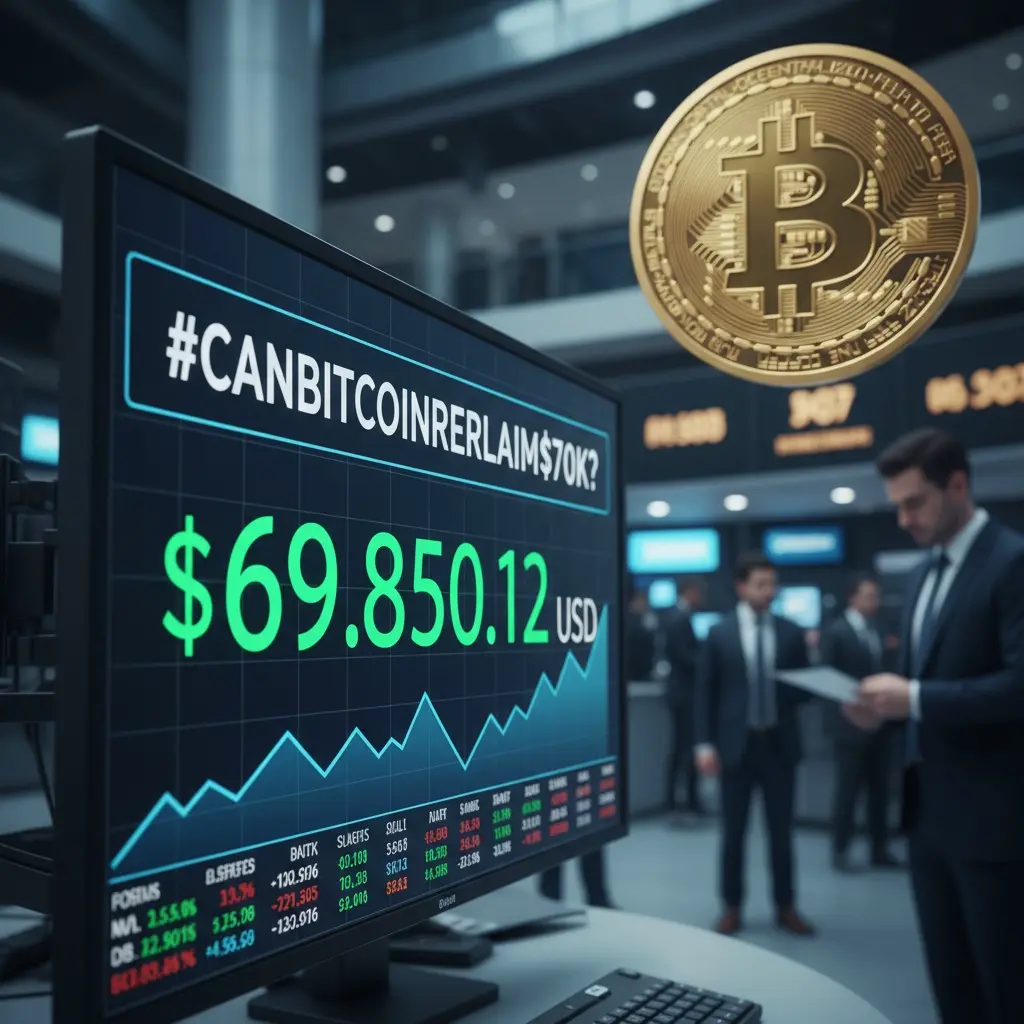
#BTC能否重返7万美元? #BTC能否重返7万美元? – Can Bitcoin Reclaim $70,000?
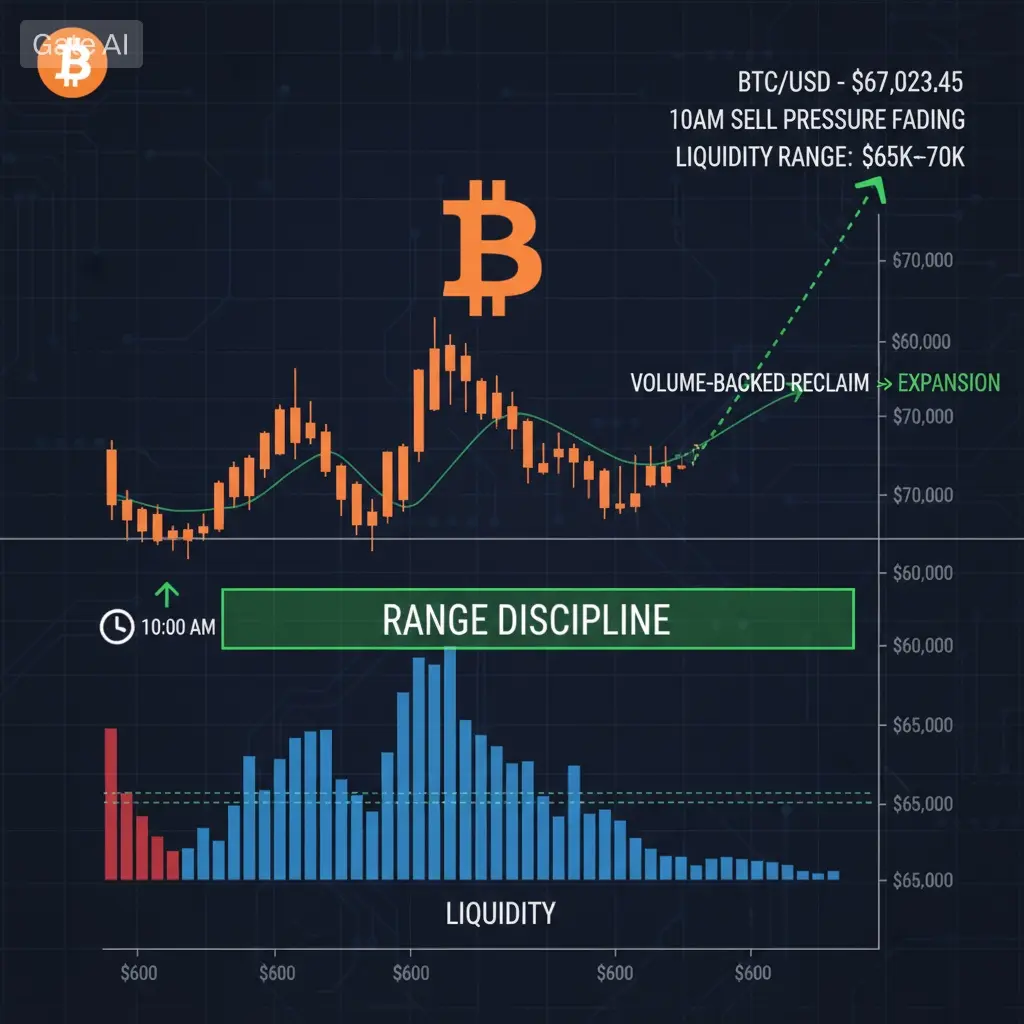
Bitcoin is currently consolidating in a tight, high-quality range around the $67,000–$67,800 zone, with aggregated price feeds showing ~$67.4K–$67.5K and minor intraday spikes testing $68K. After weeks of structured downside pressure during the US session open, that repetitive sell pattern has significantly faded. The market is no longer reacting mechanically — it is stabilizing structurally.
But this discussion is no longer about simply touching $70K.
The real question is whether Bitcoin can reclaim, hold, and structurally expand above $70K without triggering another cascade.
This is now a multi-layered strategic debate:
• Is the current structure strong enough for sustained upside?
• Has the prior sell pressure truly weakened, or merely shifted timing?
• Is order flow now spot-driven instead of leverage-dominated?
• What is the optimal strategy inside this compression phase?
Let’s break it down from every professional angle.
━━━━━━━━━━━━━━━━
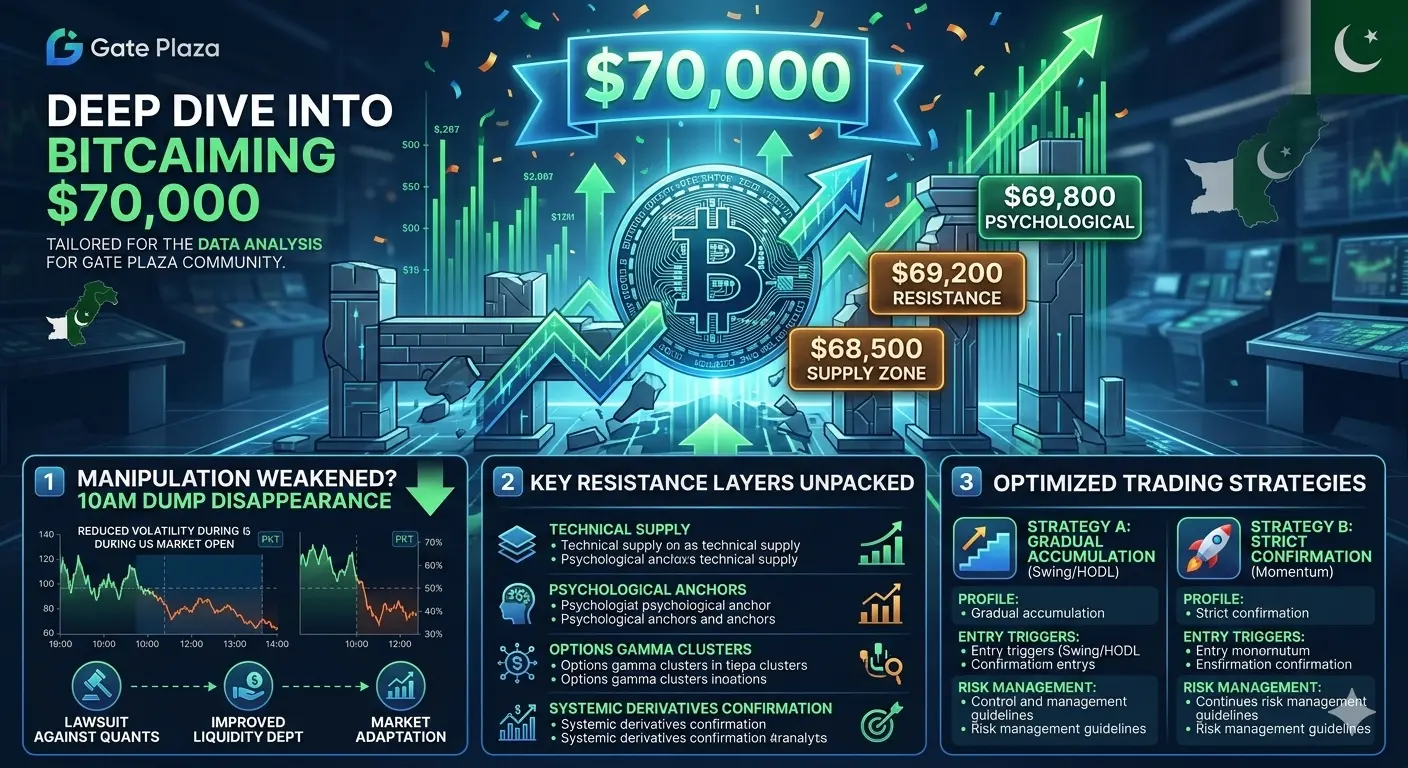
1️⃣ The Disappearance of the “10AM Dump” – Structural Shift or Temporary Pause?
For nearly three weeks, the market experienced consistent downside volatility around the US open. These were not random moves — they were precise liquidity sweeps that triggered long liquidations and forced 2–5% downside wicks.
Now that pattern has largely disappeared.
What changed?
A) Execution Behavior Shift
Large quantitative desks typically execute using TWAP/VWAP models around liquidity peaks. Under heightened scrutiny and public attention, visible aggressive selling has reduced. Instead of dumping into bids, flows appear more passive and fragmented. This reduces shock volatility and increases absorption.
B) Order Book Evolution
Previously, the $68K–$69K region was thin. Now, bid depth between $65K–$66K is significantly thicker. Dips are absorbed quickly rather than cascading lower. Funding remains mildly positive, suggesting controlled positioning rather than euphoric leverage.
C) Market Adaptation
Once a pattern becomes widely recognized, it loses edge. Traders began front-running the dump, hedging ahead of time, and fading the moves. Behavioral adaptation alone can neutralize structured volatility.
Conclusion on Structure:
The disappearance of the repeated sell window suggests improved structural integrity. Manipulative volatility has not vanished entirely — but its impact has diminished. That increases the probability of a cleaner upside expansion.
━━━━━━━━━━━━━━━━
2️⃣ The Resistance Stack Before $70K – Sequential Barriers
Reclaiming $70K is not one move — it is a sequence.
Layer 1: $68,500–$69,200
This is the immediate technical supply zone formed by recent rejections. It contains trapped shorts and prior high-volume distribution. A decisive break requires elevated spot participation and sustained volume.
Failure here likely extends the range.
Layer 2: $69,800–$70,300
This is the psychological and liquidity epicenter.
$70K is not just a number — it is a sentiment trigger.
Expect: • Stop clusters above $70K
• Options-related volatility
• Rapid delta hedging
• Media-driven momentum flows
Most first attempts at round-number breakouts fail without strong volume confirmation.
A true breakout requires: • Strong 4H or daily close above $70.3K
• Expanding volatility bands
• Balanced funding (not overheated)
• Spot-led movement
Layer 3: Derivatives Confirmation
If open interest spikes aggressively while funding turns extreme, risk of a fake breakout increases.
Healthy breakout characteristics: • Gradual OI rise
• Funding in controlled positive range
• Spot premium leading futures
Without derivatives alignment, breakouts often retrace.
Macro Overlay
Broader risk sentiment matters. Stable bond yields, contained dollar strength, and continued stablecoin inflows support upside continuation. Any macro shock can delay the move.
━━━━━━━━━━━━━━━━
3️⃣ Trading Strategy Inside Compression
This is a volatility compression phase. Expansion typically follows.
Strategy A – Gradual Accumulation
Best for swing traders and medium-term holders.
Accumulate inside $66K–$67K region with risk defined below structural support. This captures upside if the breakout develops organically. Risk: deeper macro pullback.
Strategy B – Breakout Confirmation
Wait for a confirmed daily close above $70.3K. Enter on confirmation and manage with trailing risk.
This avoids fakeouts but sacrifices early positioning.
Hybrid Strategy
Scale partially inside the range and add on confirmation. This balances positioning and caution.
━━━━━━━━━━━━━━━━
4️⃣ Technical Signals to Watch
• Bollinger Bands tightening – volatility expansion pending
• RSI neutral-bullish (not overheated)
• Higher lows forming on 4H structure
• Whale accumulation steady
• No extreme leverage imbalance
Historically, prolonged compression above a higher low resolves upward more often than downward — provided macro remains stable.
━━━━━━━━━━━━━━━━
Final Professional Assessment
Probability of Bitcoin reclaiming $70K in the near term remains favorable — but sustainability depends entirely on structure, not emotion.
As long as: • Spot demand dominates
• Funding remains controlled
• Liquidity depth holds above $65K
Upside expansion remains the higher-probability scenario.
However, until a confirmed break above $70.3K occurs, this market is technically range-bound between $65K and $70K.
The key decision for serious traders:
Are you accumulating strategically inside the range — positioning before expansion?
Or waiting for confirmed breakout strength — accepting later but safer entry?
.