
It’s been a mixed start for crypto today. Some coins are bouncing back, while others are still trying to find their footing. Let’s take a closer look at what’s happening with Worldcoin, XRP, and Pi Coin.
Over the past day, we’ve seen Worldcoin and Pi Coin post some green numbers, while XRP is basically flat. The question now is whether these moves can hold or if we’re just seeing a short-term breather before more downside.
- Worldcoin (WLD) Price Action Shows Recovery After Extended Decline
- WLD Price Prediction For Today
- XRP Price Structure Shows Weak Momentum With Limited Volatility
- XRP Price Prediction For Today
- Pi Coin (PI) Price Holds Near Support and Shows Mild Gains
Worldcoin (WLD) Price Action Shows Recovery After Extended Decline
WLD price now trades close to $0.2748 after a 7.4% gain over the past day. The price moved between recent lows and current levels, which shows a bounce after a difficult period.
That gain follows a prolonged downtrend earlier in the month, where WLD consistently struggled to hold above key moving averages.
That recent dip has pushed the Worldcoin (WLD) price to lower levels, and buyers are now intervening. However, the current price movement is not a major reversal, as the asset is still trading below its 30-day moving average.
| Metric |
| Value |
| — |
| Price |
| $0.2748 |
| RSI (14) |
| 41 |
| 7 Day SMA |
| $0.2714 |
| 30 Day SMA |
| $0.2927 |
| MACD Line |
| 0.0018 |
| Signal Line |
| $0.27 |
| Histogram |
| -32.5778 |
Momentum indicators still lean neutral to bearish. RSI sits around 41, which shows weak momentum but also places the WLD price close to oversold territory. The current reading shows that the market has cooled after more extreme levels.
Price remains mixed across moving averages. WLD trades around $0.2748, while the 7-day SMA sits near $0.2714 and the 30-day SMA near $0.2927. This is to confirm that the short-term trend is attempting to recover while the medium-term trend is weak.
MACD is still slightly positive at 0.0018, and the signal line is at $0.27. The histogram is at -32.5778, indicating bearish momentum is still present despite the recent price recovery.
WLD Price Prediction For Today
WLD shows a neutral to slightly bullish bias for today after the recent bounce and oversold conditions. Price could continue higher if it holds above the 7-day SMA near $0.2714.
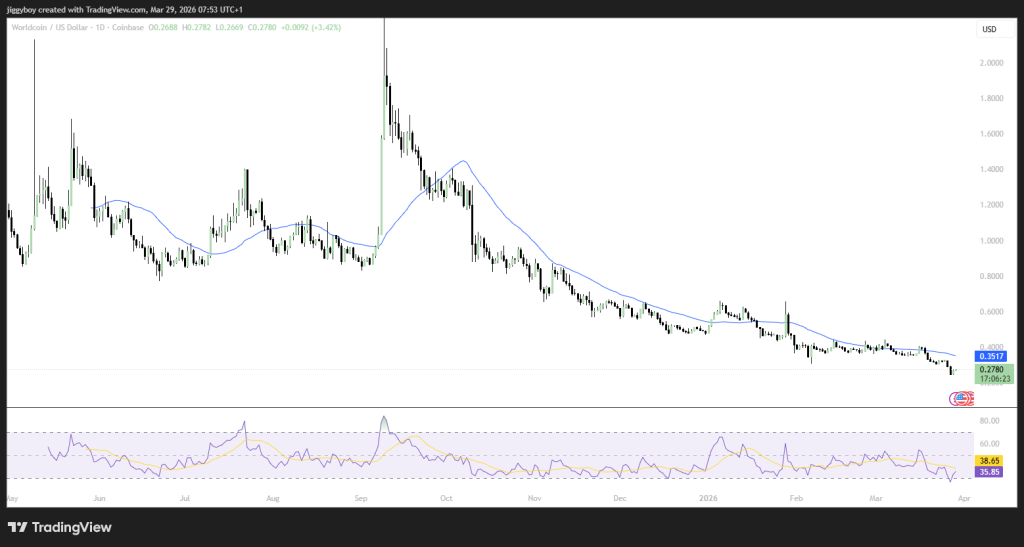
WLD Price Chart/Source:TradingView.com
If there is a move towards $0.29, there might be resistance, and this price level might be the limit unless buyers take charge again.
If there is a deeper pullback, it might be more likely if price closes below the 7-Day SMA, with the RSI falling back towards 35. This indicates a weak market but with a possibility of short-term changes.
XRP Price Structure Shows Weak Momentum With Limited Volatility
XRP price trades around $1.3350 having declined mildly by 0.02% over the past day. The price is fluctuating at recent prices.
The broader trend remains weak, as XRP has dropped from higher levels over the past week. Price now sits below both the 7 day and 30 day moving averages, which signals that short term and medium term pressure remains.
| Metric |
| Value |
| — |
| Price |
| $1.3350 |
| RSI (14) |
| 48.27 |
| 7 Day SMA |
| $1.3735 |
| 30 Day SMA |
| $1.3992 |
| MACD Line |
| Negative |
| Signal Line |
| $1.37 |
| Histogram |
| -42.5506 |
However, recent patterns from the chart indicate price actions at key levels.
The RSI is at 48.27, which is an indication of weak momentum. This still allows for some sideways movements or a small bounce.
The MACD is still negative, with the indicator line below the signal line and the histogram at -42.5506. This is an indication of a mild downward trend. The chart also shows a signal line at 1.37, which aligns with the current resistance level.
XRP Price Prediction For Today
For the rest of today, XRP price is more likely to trade in a slightly higher to sideways range. A constructive intraday shift would come if price reclaims the 7-day SMA around $1.39 and RSI pushes back above 50.
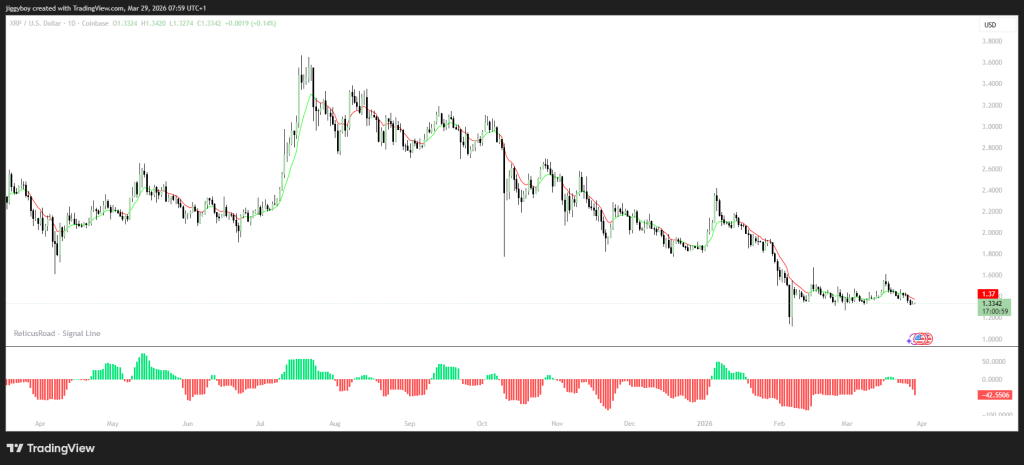
XRP Price Chart/Source: TradingView.com
With bearish momentum still present on the daily chart, a break below the $1.30 level is possible but not highly likely today.
Given this setup, short upward moves can still happen, though they may fade if the broader crypto market does not turn the risk on.
One level stands out as especially important. Resistance at around $1.37 is currently extremely strong and needs to be taken out to allow the price to move further.
Support at around $1.30 to $1.33 is also currently strong, and the momentum of the price suggests it will not fall below this zone anytime soon.
Pi Coin (PI) Price Holds Near Support and Shows Mild Gains
Pi Coin’s price is located around $0.1810, having appreciated by 3% in the last 24 hours. Price has fluctuated in recent levels, and trading volume is indicating a cautious state.
PI has lost ground over the past week, which places it in line with broader market weakness. External pressure such as general market uncertainty continues to weigh on price.
| Metric |
| Value |
| — |
| Price |
| $0.1810 |
| RSI (14) |
| 47.33 |
| 7 Day SMA |
| $0.1839 |
| 30 Day SMA |
| $0.1952 |
| MACD Line |
| Negative |
| Signal Line |
| $0.18 |
| Histogram |
| -34.87 |
However, technical indicators show early signs of stabilization.RSI is located around 47.33, and this puts Pi Coin’s price in a state of neutrality but with a slight inclination towards the bearish zone. Recent formations in the candlestick pattern in the above graph also indicate a consolidation pattern.
The price is located just below the 7-day SMA at $0.1839, and this is an immediate resistance point. The 30-day SMA is located above at $0.1952.
The MACD is in a negative state with a reading on the signal line at $0.18 and a histogram reading of -34.87. That shows that bearish pressure is still present even if the trend has not accelerated lower.
_****Here’s Why SIREN Price Exploded 115% Today**
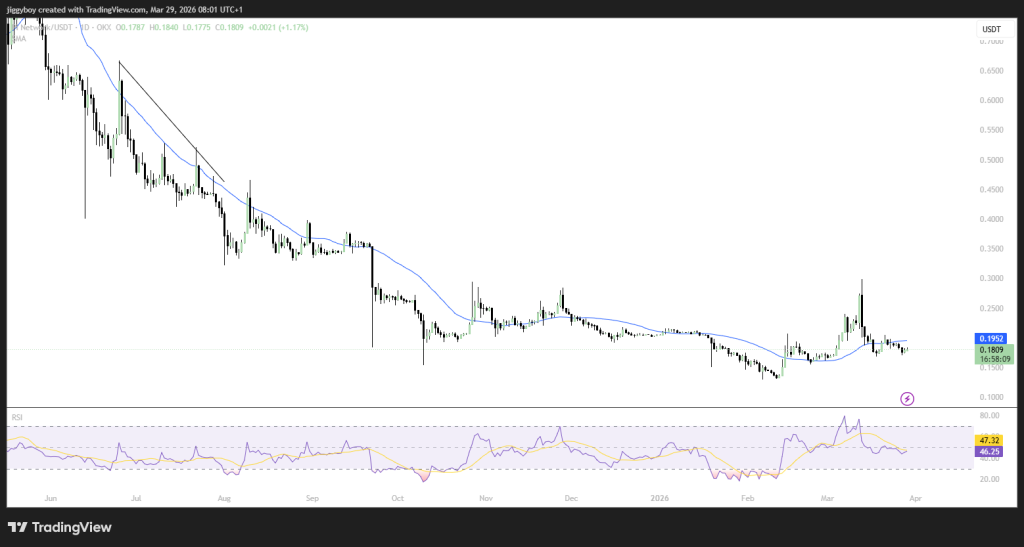
Pi Chart/Source: tradingView.com
Pi Coin price looks neutral for today, with some chance of a mild continuation higher. Price may move within the $0.178 to $0.185 range if current conditions hold.
Support near $0.176 remains critical. A break below that zone could push the price toward $0.17. A move above the 7-day SMA could trigger a mild recovery and bring price back toward the $0.19 range.
The chart shows the Pi Coin price has seen huge downward movement over time and it is attempting to find a base after extended weakness.
Disclaimer: The information on this page may come from third parties and does not represent the views or opinions of Gate. The content displayed on this page is for reference only and does not constitute any financial, investment, or legal advice. Gate does not guarantee the accuracy or completeness of the information and shall not be liable for any losses arising from the use of this information. Virtual asset investments carry high risks and are subject to significant price volatility. You may lose all of your invested principal. Please fully understand the relevant risks and make prudent decisions based on your own financial situation and risk tolerance. For details, please refer to
Disclaimer.
