In February 2026, the crypto market’s rebound above a $2.3 trillion capitalization is not merely a technical bounce, but a critical test of a new market psychology shaped by prolonged volatility.
This analysis argues that converging signals—from whale accumulation to a historic pivot in stablecoin flows—indicate a potential transition from panic-driven sell-offs to strategic, value-driven re-accumulation. For investors and builders, understanding this shift is paramount, as it may define the capital formation bedrock for the next market cycle, separating tactical relief rallies from a sustainable recovery trajectory.
From Panic Selling to Strategic Accumulation: What Changed in February 2026?
The crypto market’s recovery from a dip near $2.0 trillion in late January 2026 to over $2.3 trillion by early February is superficially familiar. Market dips have consistently been followed by rebounds throughout the asset class’s history. However, the underlying behavioral and on-chain data from this specific period reveals a departure from the reactive, sentiment-driven trading of the preceding months. The change is not just in price, but in the quality of capital entering the market and the strategic patience exhibited by its largest holders.
The “why now” can be traced to a confluence of technical and psychological thresholds being tested. The market’s sweep of the April 2025 lows—levels tied to significant macroeconomic news—acted as a litmus test for long-term conviction. This zone represented a collective memory of past fear, and its successful defense (closing above it) provided a technical narrative strong enough to catalyze a shift in behavior. It presented a clear, historically-referenced level where the risk-reward calculus for accumulation became compelling for entities with longer time horizons.
Furthermore, this shift occurs after “several weeks of heightened volatility,” as noted by analysts. This extended period of uncertainty likely exhausted weaker hands, distributing assets from short-term, leveraged traders to entities with stronger holding power. The market reached a point of localized exhaustion in selling pressure, creating the vacuum into which deliberate, accumulation-focused capital began to flow. The change, therefore, is a maturation of market response: moving from a reflex to sell on fear to a disciplined strategy of buying perceived structural value.
The Anatomy of a Market Inflection: Psychology, Capital, and On-Chain Confirmation
The rebound is powered by a clear, two-tiered mechanism involving both retail and institutional-grade capital, with on-chain analytics serving as the definitive confirmation tool. This isn’t a speculative frenzy; it’s a recalibration. The primary driver is the reversal of stablecoin flows. After months of decline, the surge of stablecoins onto exchanges—with ERC-20 stablecoin inflows doubling from $51 billion to $102 billion in seven weeks—is a capital deployment signal of the first order. This capital represents dry powder seeking asset exposure, not leverage for amplification.
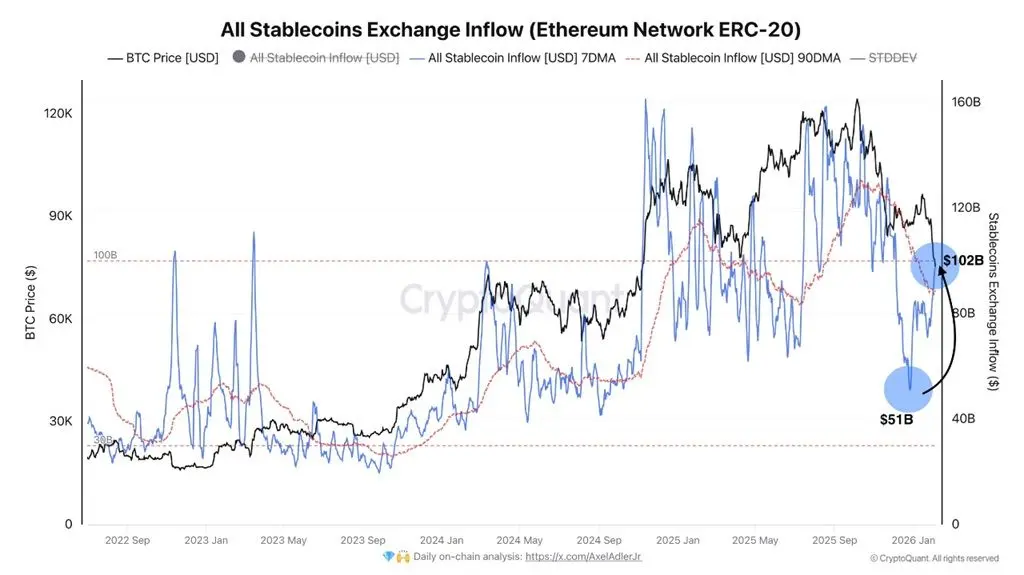
(Source: CryptoQuant)
The impact chain is sequential and logical. First, prices fall to a level that triggers algorithmic liquidations and panic selling from retail portfolios, creating supply. Second, this supply is met not with more fear, but with the dormant capital represented by stablecoins waiting on the sidelines. The entity benefiting most directly from this phase is the strategic accumulator: the whale wallet, the disciplined fund, and the patient retail investor who programmed buy orders at these technical levels. They acquire assets from forced sellers at a discount.
Conversely, the entities under pressure are those reliant on high volatility and momentum. Leveraged short positions become risky in a stabilizing environment, and protocols or traders dependent on continuous, high-volume speculation find fewer opportunities as the market transitions from a trending to a ranging state, as forecasted by analysts like Daan Crypto Trades. The system-wide impact is a gradual increase in the average cost basis of holdings and a reduction in easily-tradable float, which creates a firmer foundation for price appreciation, provided key support holds.
The Three-Pillar Framework of a Valid Recovery Signal
To distinguish a true inflection from a bear market rally, three concurrent pillars must be observed. The current data suggests alignment across all three, forming a robust thesis for a shift in market structure.
Pillar One: The Return of Deployment Capital
The doubling of stablecoin exchange inflows is the most critical quantitative signal. It answers the question, “Is there buying power?” This capital acts as immediate, price-insensitive demand. Its growth above the 90-day average indicates a decisive change in investor posture from defensive hoarding to offensive positioning, providing the fuel for any sustained upward move.
Pillar Two: The Consensus of the Cohort
Glassnode’s Accumulation Trend Score moving into positive territory across wallet sizes is a qualitative breadth indicator. It answers the question, “Who is buying?” When wallets from small holders to mega-whales (10-100 BTC cohort) simultaneously show accumulation, it signals a market-wide re-assessment of value, not a niche or speculative play. This broad-based consensus reduces the risk of a sharp reversal led by a single group profit-taking.
Pillar Three: The Defense of Macro Value
The market’s successful hold above the April 2025 low and the $2.3 trillion TOTAL market cap level is the technical validation. It answers the question, “Where is the line in the sand?” This level transforms from resistance into support, creating a psychological and technical floor. As analyst commentary emphasizes, holding this zone justifies the expectation of a recovery toward higher targets like $2.8 trillion, as it invalidates the bearish breakdown narrative.
This confluence turns isolated data points into a coherent narrative of changing market microstructure. It is the difference between spotting a single green candle and identifying a change in the regime of order flow.
Beyond Bitcoin: The Ripple Effects of a Structural Re-accumulation Phase
A market-wide re-accumulation phase, if confirmed, has profound and uneven implications across the crypto industry. It reshapes capital allocation, project viability, and sector leadership. The initial data highlights accumulation in both Bitcoin and Ethereum, suggesting a “blue-chip” focus, but the effects will cascade.
Firstly, Layer-1 and Layer-2 ecosystems with strong fundamentals and clear roadmaps will experience a disproportional benefit. As general market fear recedes, attention and capital flow toward differentiation. Projects that continued building during the downturn, achieving technical milestones or growing organic usage, will be re-rated by the market. Conversely, “ghost chain” projects with high valuations but no activity will see no relief, leading to a widening performance gap and accelerating the industry’s maturation.
Secondly, the DeFi sector faces a dual-edged sword. A stabilization in ETH and blue-chip token prices improves collateral ratios and reduces systemic liquidation risks. However, if volatility declines sharply as analysts predict, volumes and fees for decentralized exchanges and perpetual protocols may suffer in the short term. The beneficiaries will be lending protocols and yield strategies that thrive in a stable-to-bullish, range-bound environment where users seek productive asset utilization rather than speculative trading.
Finally, this phase directly impacts capital formation for new ventures. Venture capital and token launch dynamics are tightly coupled with secondary market liquidity and sentiment. A credible floor in major asset prices rebuilds risk appetite. We can expect a thaw in early-stage funding rounds and a more discerning but active market for quality token launches in the latter half of 2026, as investors gain confidence in the exit environment.
Future Paths: Three Scenarios for the 2026 Crypto Market Recovery
Based on the current convergence of signals, the market is at a branch point. The path forward is not predetermined, but the probabilities can be assessed along three primary trajectories.
Scenario One: The Confirmed V-Shaped Recovery (Probability: Medium)
This path requires the $2.3 trillion TOTAL level to hold firm and become a launchpad. Sustained stablecoin inflows and whale accumulation would need to continue, quickly absorbing any remaining sell-side pressure. Bitcoin stabilizing above $71,000, as highlighted by analyses, would act as a catalyst, likely triggering a wave of institutional and retail FOMO (Fear Of Missing Out). This could propel the market toward the $2.8 trillion target in a relatively short timeframe, validating the most bullish interpretations of the current data. The risk is that it may over-extend and create a parabolic move vulnerable to a sharp correction.
Scenario Two: The Extended Re-accumulation Range (Probability: High)
This is the path most aligned with analyst observations of declining volatility. The market establishes a higher low above the $2.3 trillion floor but struggles to break through immediate overhead resistance. It enters a multi-week or even multi-month consolidation range, perhaps between $2.3T and $2.6T. This scenario is arguably healthier for long-term bull market development. It allows for sector rotation, fundamental reassessment of projects, and the shaking out of weak leverage without dramatic price drops. It is a period of “stealth” accumulation where smart capital builds positions quietly before the next major leg up.
Scenario Three: The False Dawn and Retest (Probability: Low, but Critical)
The bullish signals fail to hold. A macroeconomic shock, regulatory event, or unexpected failure of a major entity could break the $2.3 trillion support. In this scenario, the current accumulation is revealed to be insufficient against a new wave of macro-driven selling. The market would be forced to seek a lower support level, potentially invalidating the recent positive structure. While currently less probable given the strength of the data, this scenario is a necessary risk management consideration. It would signify that the market requires a deeper, more painful capitulation event to finally base.
Practical Implications for Investors and Builders
For different market participants, the current signals dictate distinct actionable strategies.
For** **tactical traders, the environment shifts from trend-following shorts to range-aware strategies. Key levels—$2.3T TOTAL support, $71,000 BTC, and overhead resistances—become the primary focus. Declining implied volatility may favor selling options premiums or employing mean-reversion strategies within established ranges. The on-chain data (whale accumulation zones) can inform key support areas for long entries.
For** **long-term investors and funds, this period is for strategic portfolio rebalancing and due diligence. The broadening accumulation trend is a green light for disciplined dollar-cost averaging into blue-chip assets. More importantly, it is the time to deeply research and position in high-conviction altcoin projects that have weathered the bear phase, as they stand to outperform in a recovery. The stablecoin inflow metric serves as a macro gauge for overall risk appetite; its continuation validates deployment.
For** **project founders and builders, this is a signal to prepare for a change in narrative. The discourse may slowly shift from survival to growth. Communicating roadmaps, partnership announcements, and technical achievements will regain market attention. For projects considering token launches or fundraises, a stabilizing market improves reception but also raises the bar for quality. Builders must demonstrate tangible progress, not just promises, to capture the returning capital.
What is the TOTAL Crypto Market Cap (TOTAL)?
The TOTAL market capitalization is the aggregate value of all cryptocurrencies tracked by data providers. It is a crucial macro indicator for the digital asset industry, analogous to the S&P 500 for U.S. equities. Unlike individual asset prices, TOTAL reflects the broader health, capital inflows, and investor sentiment toward the crypto asset class as a whole.
Tokenomics & Composition: TOTAL is not a tradable token but an index. Its “tokenomics” are the sum of the market caps (circulating supply * price) of thousands of constituent assets, dominated by Bitcoin and Ethereum. Its movement is therefore a weighted average, heavily influenced by these largest assets but sensitive to sector-wide trends.
Roadmap & Evolution: The metric’s “roadmap” is the evolution of the industry itself. Its growth is driven by new capital adoption, technological innovation creating new asset classes (DeFi, NFTs, RWAs), and the appreciation of underlying networks. Key milestones in its history include first reaching $1 trillion, the peak near $3 trillion in previous cycles, and its resilience at various macro support levels.
Positioning: In market analysis, TOTAL is the primary chart for assessing the industry’s macro trend. Holding key levels, such as the April 2025 low discussed by analysts, is interpreted as a sign of structural strength. A breakout to new highs confirms a bull market, while a breakdown suggests a bearish phase. It is the foundational chart from which all other sector analyses stem.
The 2026 Inflection: Building on a Foundation of Strategic Patience
The events of early February 2026 represent more than a price rebound. They are the emerging signature of a market transitioning from a phase dominated by emotional, reactive trading to one governed by strategic capital allocation and value recognition. The simultaneous resurgence of stablecoin deployment capital, broad-based on-chain accumulation, and the defense of a critical technical level forms a credible, multi-factor case for a structural shift.
This does not guarantee a frictionless ride upward. The high-probability path involves volatility compression and range-bound action, a necessary process for rebuilding a sustainable bullish trend. For the industry, this potential inflection point validates the resilience built during the preceding volatile period. It suggests that the market is beginning to discount transient fears and price in longer-term network value and innovation trajectories. The task for serious participants now is to align strategies with this new phase of deliberate accumulation, using data over dogma to navigate the complex but promising landscape ahead. The market is not just recovering; it is recalibrating on a firmer, more discerning foundation.
