
Key Takeaways
-
XRP is down over 25% in 30 days, underperforming most major altcoins.
-
Price has lost both the 50-week and 100 MA, signaling weakening momentum.
-
XRP’s current structure closely mirrors CRO’s 2024 fractal, which led to a ~50% drop.
-
If the pattern holds, XRP could consolidate near $1.60 before targeting deeper support around $0.30.
-
Reclaiming the 50-week MA near $2.40 would invalidate the bearish fractal.
The broader altcoins crypto market has faced heavy selling pressure over the past 30 days, with Ethereum (ETH) sliding more than 28%, keeping sentiment weak across the board.
Among major altcoins, XRP has been one of the weakest performers, dropping over 16% in the past week and extending its 30-day decline to 25%. More importantly, a growing number of traders are now pointing to a fractal similarity with Cronos (CRO) — a setup that previously led to a deep corrective move.
If history rhymes, XRP may not be done falling just yet.
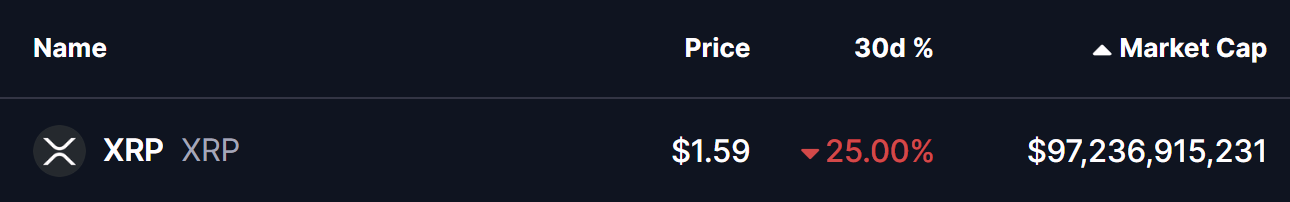
Source: Coinmarketcap
Fractal Setup Hints at Further Downside
A side-by-side comparison of CRO and XRP reveals some striking similarities in structure.
Back in late 2024, Cronos was rejected from the upper boundary of a right-angled ascending broadening wedge before entering a sharp corrective phase. Soon after, CRO slipped below its 50 and 100 moving averages, signaling weakening momentum. What followed was a prolonged sell-off that eventually stretched into a near 50% drawdown, pushing price back into its accumulation support zone.
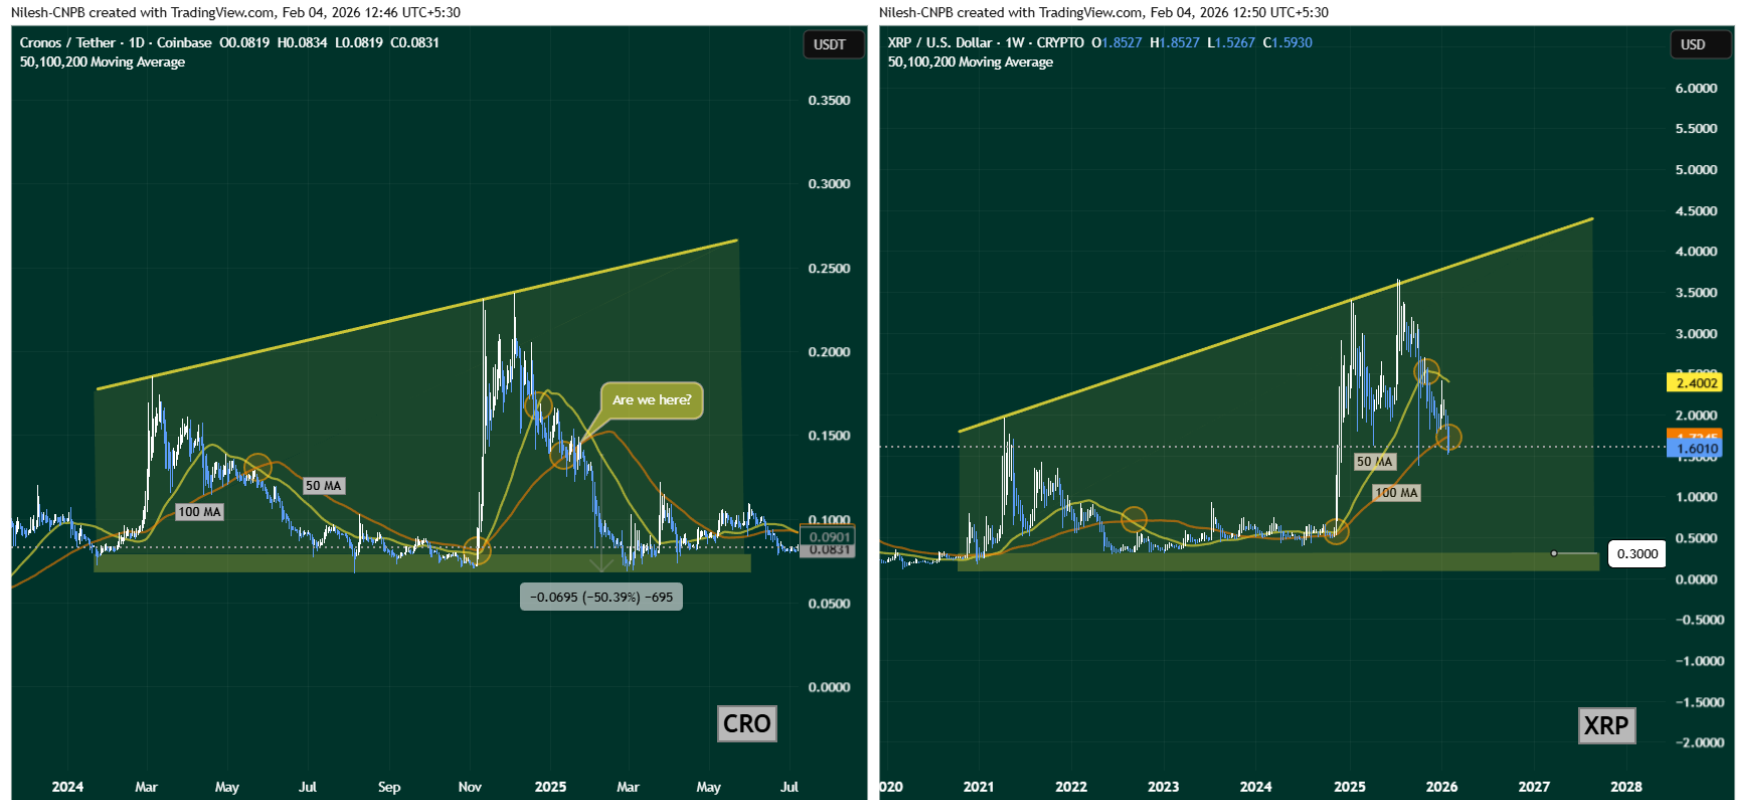
CRO and XRP Fractal Chart/Coinsprobe (Source: Tradingview
XRP now appears to be following a very similar script.
After peaking near upper resistance around $3.65 in mid-2025, XRP rolled over and entered a steep correction. Price first lost its 50-week moving average, and this week confirmed a breakdown below the 100 MA — closely mirroring CRO’s mid-correction phase that later triggered its larger drop.
With the fractal lining up almost point-for-point, the technical picture suggests that bearish momentum remains firmly in control.
The moving averages are rolling over, price is making lower highs, and XRP is struggling to regain any meaningful strength — all classic signs of a market still searching for a bottom.
What’s Next for XRP?
If this fractal continues to play out, XRP may first consolidate around the current $1.60 area as short-term buyers attempt to stabilize price.
However, if selling pressure persists, the chart opens the door for a deeper move toward the long-term support zone near $0.30 over the coming months — roughly aligning with the magnitude of CRO’s historical decline.
On the flip side, bulls still have a chance to invalidate this bearish setup.
A strong reclaim of the 50-week moving average near $2.40 would be an early sign that momentum is shifting back in XRP’s favor and that this fractal comparison may fail.
For now though, the weekly structure keeps XRP technically vulnerable. Until key moving averages are recovered, the path of least resistance appears tilted to the downside, with traders closely watching whether this familiar CRO-style fractal plays out once again.
Disclaimer: The views and analysis presented in this article are for informational purposes only and reflect the author’s perspective, not financial advice. Technical patterns and indicators discussed are subject to market volatility and may or may not yield the anticipated results. Investors are advised to exercise caution, conduct independent research, and make decisions aligned with their individual risk tolerance.
About Author: Nilesh Hembade is the Founder and Lead Author of Coinsprobe, with over 5 years of experience in the cryptocurrency and blockchain industry. Since launching Coinsprobe in 2023, he has been providing daily, research-driven insights through in-depth market analysis, on-chain data, and technical research.
Disclaimer: The information on this page may come from third parties and does not represent the views or opinions of Gate. The content displayed on this page is for reference only and does not constitute any financial, investment, or legal advice. Gate does not guarantee the accuracy or completeness of the information and shall not be liable for any losses arising from the use of this information. Virtual asset investments carry high risks and are subject to significant price volatility. You may lose all of your invested principal. Please fully understand the relevant risks and make prudent decisions based on your own financial situation and risk tolerance. For details, please refer to
Disclaimer.
Related Articles
One Client Alone Moves $250M-$750M Annually Through Ripple’s XRP-Powered Rails
A Ripple SVP revealed that a single client is moving between $250 million and $750 milion through Ripple’s XRP-powered platform.
A popular crypto commentator said that the customer’s profile fits that of Franklin Electric, a global water and energy distributor.
A senior official at Ripple
Blockzeit15m ago
XRP Ledger reaches 120 TPS, activity surges but the price remains "stagnant."
The XRP ledger is experiencing unusual activity, processing 600-700 transactions per block and over 120 transactions per second without increasing fees. This surge is mainly due to decentralized exchange (DEX) activities, particularly mass order cancellations. Despite the increase in on-chain activity, XRP's price has not reacted, indicating a disconnect between network activity and market response.
TapChiBitcoin2h ago
Ripple (XRP) News Today: March 19
Ripple remains one of the most talked-about projects in the crypto space, driven by constant developments across its ecosystem.
Despite the ongoing market correction, XRP (the company’s native token) has posted weekly gains, whereas some key indicators suggest a more substantial rally could be on t
CryptoPotato2h ago
XRP faces an 18% decline risk as a bearish flag pattern forms.
The price of XRP has recorded a recovery of about 3% from the low of $1.31 established on March 27, thus reclaiming the $1.35 mark. However, this development is likely forming a bear flag pattern, rather than opening up a sustainable recovery trend, especially in the context of the overall market still lacking momentum.
TapChiBitcoin2h ago
