
Key Takeaways
-
Gold and silver suffered their largest crash in decades, wiping out over $7 trillion in market value within 36 hours.
-
The sell-off appears linked to rising macro uncertainty and expectations of a more hawkish Federal Reserve stance.
-
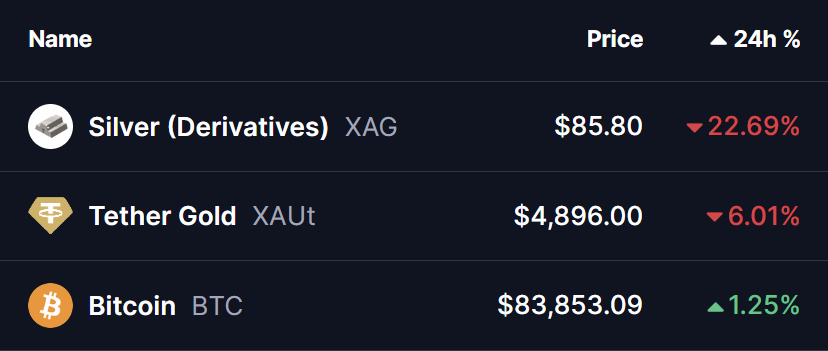
Despite the chaos in commodities, Bitcoin remained resilient, trading near $84K and staying in the green.
-
The BTC/GOLD ratio continues to respect a long-term ascending triangle, signaling potential upside for Bitcoin.
The global **commodity market **has been rocked by one of its sharpest sell-offs in decades, with panic-driven moves ripping through precious metals over the last 36 hours. The crash appears to be fueled by growing macro uncertainty after President Donald Trump reportedly nominated Kevin Warsh, a former Federal Reserve governor known for his hawkish stance on inflation, as the next Fed Chair.
The reaction was brutal.
More than $7 trillion in market value has been wiped out from precious metals in just a day and a half.
-
Silver plunged 22%, falling toward the $85 level and erasing roughly $1.96 trillion in value.
-
Gold dropped nearly 6%, slipping below $4,900 and wiping out over $5 trillion.
Source: Coinmarketcap
While traditional safe havens collapsed, Bitcoin told a very different story.
Bitcoin Holds Firm as “Digital Gold” Narrative Strengthens
Amid the chaos in commodities, the cryptocurrency market showed relative resilience. Bitcoin (BTC) managed to stay in the green, trading near the $84,000 region, reinforcing its growing reputation as digital gold.
This divergence is becoming even more interesting when viewed through the BTC/GOLD ratio, which often highlights long-term capital rotation between traditional and digital stores of value.
BTC/GOLD Chart Signals a Potential Shift in Momentum
On the monthly BTC/GOLD chart, price action continues to respect a large ascending triangle structure, a pattern commonly associated with bullish continuation or long-term trend reversals.
This setup is defined by:
-
A rising trendline, marking a series of higher lows since 2017
-
A strong horizontal resistance zone between $36.84 and $41.07, which has capped upside multiple times
During the recent gold crash, the BTC/GOLD pair once again pulled back to test its long-term ascending trendline near $15.14—a level that has consistently acted as a major demand zone over multiple cycles.
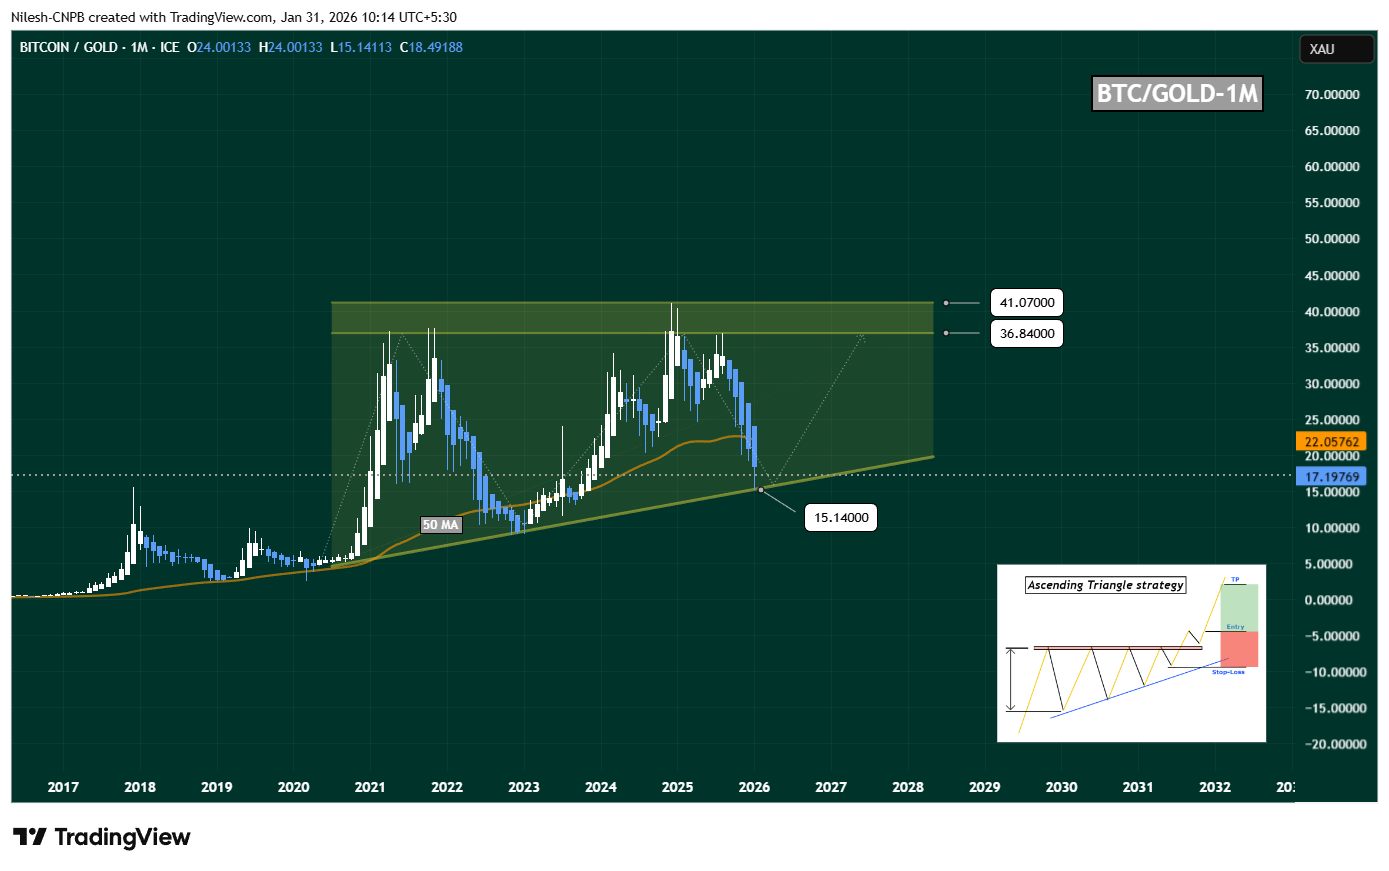
BTC/XAU Monthly Chart/Coinsprobe (Source: Tradingview)
Rather than breaking down, price respected this support, suggesting that the current move is a rotation within the triangle, not a structural breakdown.
50-Month Moving Average Remains the Key Pivot
At present, BTC/GOLD is trading below the 50-month moving average, located near $22.05. This level has historically acted as a momentum switch.
A monthly reclaim of the 50MA would be a strong signal that buyers are stepping back in and that Bitcoin is beginning to outperform gold once again.
If that happens, momentum could accelerate quickly.
What’s Next for Bitcoin (BTC)?
If bulls successfully:
-
Defend the ascending trendline near $15.14, and
-
Push price back above the 50-month moving average,
then BTC/GOLD could make another run toward the $36.84–$41.07 resistance zone.
A clean breakout above this ceiling would confirm a long-term trend shift and potentially mark the start of a powerful Bitcoin outperformance cycle against gold.
On the flip side, a decisive monthly close below the rising support would weaken the bullish thesis and suggest that further consolidation—or deeper downside—may be needed before any sustainable rotation resumes.
Bottom Line
While gold and silver are experiencing historic drawdowns, Bitcoin is quietly holding its ground. The BTC/GOLD chart continues to respect a long-term bullish structure, suggesting this divergence may not be temporary.
If support near $15.14 holds and BTC/GOLD reclaims its 50-month moving average, Bitcoin could be entering a phase where it shines brightest precisely when traditional safe havens falter.
Disclaimer: The views and analysis presented in this article are for informational purposes only and reflect the author’s perspective, not financial advice. Technical patterns and indicators discussed are subject to market volatility and may or may not yield the anticipated results. Investors are advised to exercise caution, conduct independent research, and make decisions aligned with their individual risk tolerance.
About Author: Nilesh Hembade is the Founder and Lead Author of Coinsprobe, with over 5 years of experience in the cryptocurrency and blockchain industry. Since launching Coinsprobe in 2023, he has been providing daily, research-driven insights through in-depth market analysis, on-chain data, and technical research.
Disclaimer: The information on this page may come from third parties and does not represent the views or opinions of Gate. The content displayed on this page is for reference only and does not constitute any financial, investment, or legal advice. Gate does not guarantee the accuracy or completeness of the information and shall not be liable for any losses arising from the use of this information. Virtual asset investments carry high risks and are subject to significant price volatility. You may lose all of your invested principal. Please fully understand the relevant risks and make prudent decisions based on your own financial situation and risk tolerance. For details, please refer to
Disclaimer.
Related Articles
USD/JPY Hits 160 Again – Is a Bitcoin Crash Coming Next?
_USD/JPY crosses 160 for the first time since July 2024, raising attention from global investors._
_July 2024 BOJ intervention dropped USD/JPY 20 points, Bitcoin 30%, and S&P 500 10%._
_Strengthening yen raises borrowing costs for leveraged investors, affecting stocks and crypto
LiveBTCNews20m ago
The cryptocurrency fear index has dropped to 9, with the market continuing to maintain "extreme fear."
The current cryptocurrency market fear and greed index has dropped to 9, indicating extreme fear in the market, well below yesterday's 12 and last month's average of 13. This index consolidates multiple indicators to assess market sentiment.
BlockBeatNews1h ago
Bitcoin Sell-Off Reveals Whale-Driven Rotation as Retail Capitulates and Leverage Resets
_Whales drove the sell-off, absorbed liquidity, while retail exited and leverage flushed across the market._
Bitcoin’s recent price action points to a calculated liquidity event rather than broad market weakness. A sharp decline initially appeared tied to macro uncertainty, but the underlying
LiveBTCNews1h ago
CEO of Goldman Sachs admits to holding Bitcoin amid accelerating institutionalization
David Solomon, CEO of Goldman Sachs, acknowledged holding a small amount of Bitcoin in February 2026, contrasting with his 2024 stance of viewing it as speculative. This reflects Wall Street's deepening involvement in crypto, amid legal constraints. The positive community reaction suggests a normalization of Bitcoin among affluent individual and institutional investors.
TapChiBitcoin2h ago
Since the "1011 crash," the BTC ETF has recovered $3 billion in outflows, and the fund flows for the year are close to flat.
According to Bloomberg's data, from October 2025 to the end of February 2026, Bitcoin ETF saw an outflow of approximately $9 billion, with about $3 billion recovered so far. Although the overall net outflow still exceeds $6 billion, the inflow and outflow of funds in 2026 have nearly balanced out.
GateNews2h ago
