
SUI price has quietly slipped into a zone that usually decides everything. Charts show an 80% drop from the peak, yet the market is no longer moving fast. This slowdown matters because SUI now trades near levels that previously defined major trend shifts. Crypto Patel highlighted this moment as one where structure speaks louder than hype, especially after months of steady decline.
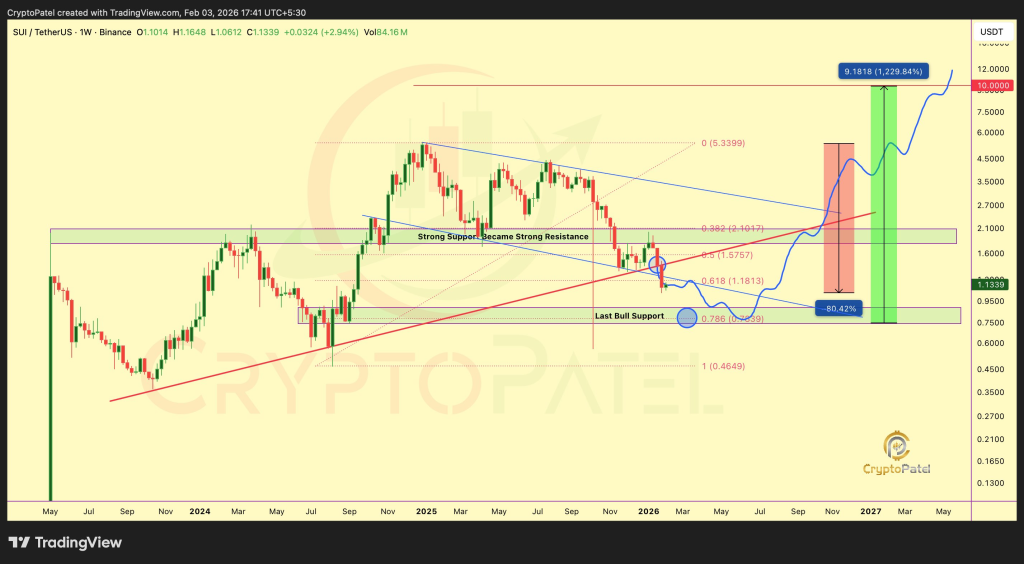
SUI price outlook has changed since the long term uptrend gave way. The chart shared by Crypto Patel shows SUI falling from the $5.37 high to the $1.10 area, marking an 80% correction. Price now sits inside a higher time frame corrective structure, where decisions tend to stick for months. That structure explains why every small move now feels heavier than before.
Crypto Patel points to the Fibonacci support zone between 0.618 and 0.786 as the current battlefield. SUI price touching this region signals a test of long term confidence. Buyers previously defended similar zones during earlier market cycles, which adds weight to this moment.
@CryptoPatel / X
SUI Price Prediction Hinges On Holding The $0.78 Support Zone
SUI price prediction depends largely on one number. Crypto Patel identifies $0.78 as the last bullish structure support, tied to the 0.786 Fibonacci level. Weekly candles closing above this area keep the broader recovery idea alive. Price losing this zone would change the conversation entirely.
The chart also shows former support near $1.57 turning into resistance. SUI price failed to reclaim that level after the breakdown, which confirms the shift in structure. Crypto Patel notes that reclaiming $1.57 would reopen paths toward $2.10, yet that step requires strength that has not appeared yet.
SUI Price Structure Shows Why Volatility Has Compressed
SUI price action feels quiet because compression often follows sharp drops. Crypto Patel explains that after large corrections, markets pause as participants reassess risk. This pause creates narrow ranges that precede expansion. Direction usually follows structure, not emotion.
Gold and Silver Are Pumping Again: Why BTC Could Follow This Time_**
Price now reacts closely to the descending trendline drawn from the highs. SUI remains below that line, which keeps pressure intact. A clean move above it would signal structural repair, yet no such move has appeared so far.
Crypto Patel outlines clear levels that frame the current SUI price outlook. Resistance sits near $1.57 and $2.10. Support rests at $0.78, with deeper protection near $0.46. These zones act as checkpoints rather than predictions.
Disclaimer: The information on this page may come from third parties and does not represent the views or opinions of Gate. The content displayed on this page is for reference only and does not constitute any financial, investment, or legal advice. Gate does not guarantee the accuracy or completeness of the information and shall not be liable for any losses arising from the use of this information. Virtual asset investments carry high risks and are subject to significant price volatility. You may lose all of your invested principal. Please fully understand the relevant risks and make prudent decisions based on your own financial situation and risk tolerance. For details, please refer to
Disclaimer.
Related Articles
Today’s Crypto Fear and Greed Index has fallen to 9, and the market is in extreme fear.
Gate News message, March 29, according to data from Alternative.me, today the Crypto Fear & Greed Index has fallen to 9, down further from yesterday’s 12, and the market is still in an “extreme fear” state.
GateNews8m ago
Bittensor (TAO) Hits a 3-Month Peak: What Caused the Rally and What Comes Next?
Many leading cryptocurrencies have posted slight declines or negligible increases over the past 24 hours, but this isn’t the case for Bittensor (TAO), whose price soared by 15%.
The question now is whether this momentum can hold or if a pullback is coming next.
Further Gains
CryptoPotato1h ago
ETH falls 0.85% in 15 minutes: Exchange outflows and ETF trimming in sync amplify volatility
From 23:00 to 23:15 (UTC) on March 28, 2026, the price of ETH fluctuated downward within the range of 1,989.32 to 2,012.0 USDT, recording a return of -0.85%, with a volatility of 1.13%. During this period, market attention increased, and short-term fluctuations intensified, prompting traders to closely monitor the performance of key support zones.
The main driver of this volatility is the continuous outflow of ETH from major exchanges to on-chain wallets since March, with a total outflow of 31.6 million coins, leading to a contraction in exchange liquidity and causing prices to be sensitive to large orders. Meanwhile,
GateNews1h ago
Is the XRP Bottom Finally Here? 3 Massive Bullish Signals You Need to See
Although in a more modest manner, XRP whales have returned to the scene, amassing more tokens over the past week, which is categorized as the first bullish sign for the underlying asset.
Another could come in the form of the technical tool used to determine whether that asset’s move in either
CryptoPotato2h ago
Bitcoin’s Most Dangerous Pattern Just Triggered: Will BTC Dump to $26K Next?
Although bitcoin has already dumped by over 50% from its all-time high of over $126,000 marked in October to a multi-year low of $60,000, the asset’s troubles might not be over, warned Merlijn The Trader.
The popular analyst indicated that the “most dangerous bitcoin pattern just completed phase
CryptoPotato2h ago
