
Key Takeaways
-
ZEC is holding a major support zone between $300–$335 after a 30% monthly correction.
-
A descending triangle pattern is forming on the daily chart.
-
A breakout above $411 could signal the start of a renewed bullish move.
Zcash (ZEC) is showing early signs of stabilization after a sharp corrective phase. As of January 26, 2026, ZEC is trading near the $360 level, posting a 4% gain over the past 24 hours. This bounce comes after a steep 30% decline over the last month, which followed ZEC’s explosive 2025 rally, where the privacy-focused cryptocurrency surged more than 800% at its peak, reaching levels near $750.
While broader market conditions remain volatile, ZEC’s latest price action suggests that the asset may be approaching a decisive moment — one that could determine whether bulls regain control or bears extend the correction.
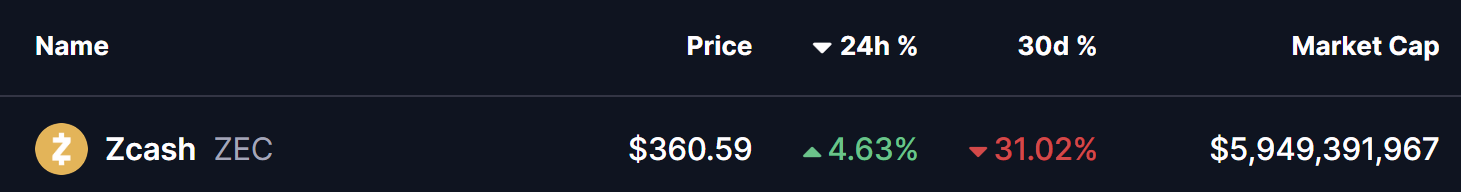
Source: Coinmarketcap
Descending Triangle Takes Shape on the Daily Chart
From a technical perspective, Zcash’s daily chart reveals a well-defined descending triangle pattern, a structure that typically forms after a strong uptrend and often precedes a major directional move.
This pattern is characterized by two key elements:
-
A horizontal support zone between $300 and $335, which has consistently attracted buyers during recent pullbacks.
-
A sequence of lower highs, creating a downward-sloping resistance line originating from the 2025 peak near $750.
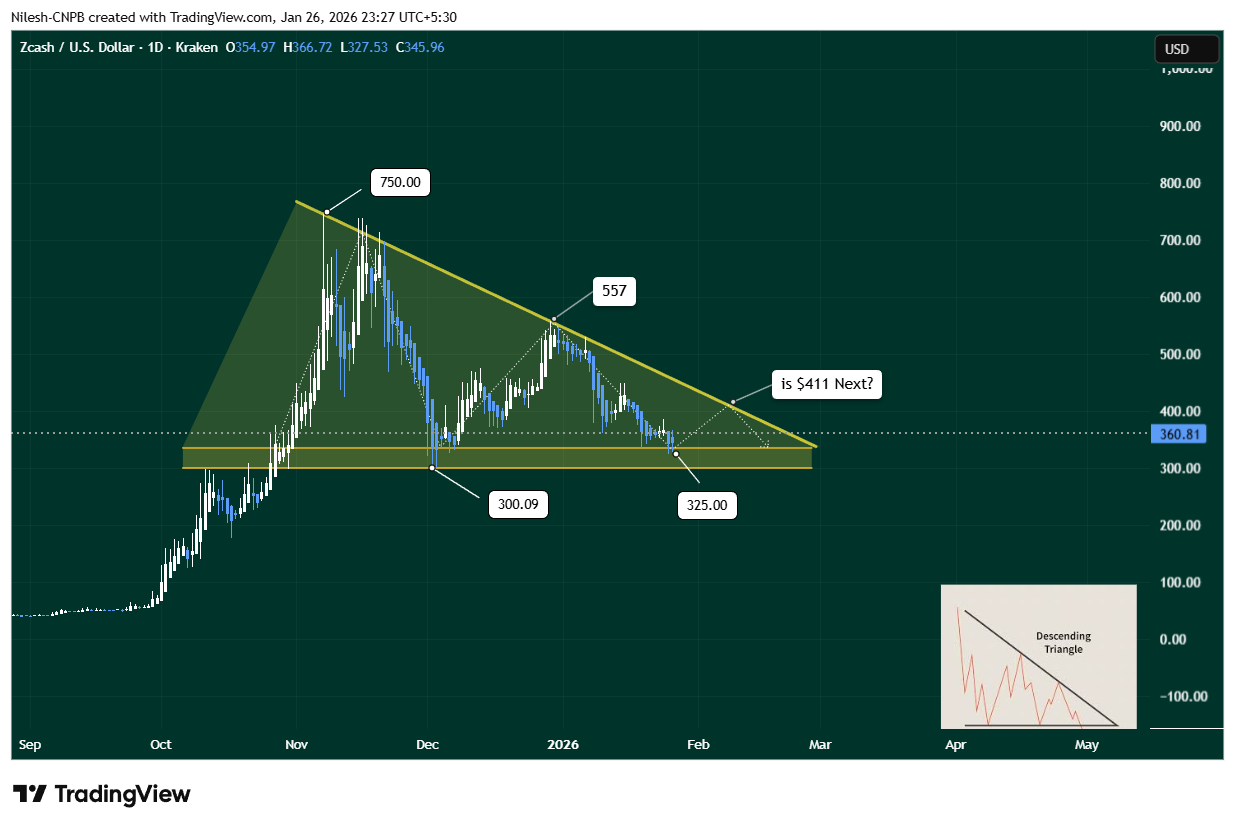
Zcash (ZEC) Daily Chart/Coinsprobe (Source: Tradingview)
During the most recent leg of the correction, ZEC dipped into the lower boundary of this support zone, finding demand near $325. Buyers stepped in aggressively at this level, triggering a rebound that lifted price back toward the $360 area. This reaction suggests that bulls are actively defending the structure and are not yet willing to concede control.
The repeated defense of the $300–$335 region highlights its importance as a critical accumulation zone. As long as ZEC continues to trade above this range, the broader technical structure remains intact.
What’s Next for ZEC?
Looking ahead, If ZEC continues to sustain above the support trendline, the next logical move would be a retest of the descending resistance near $411.
-
Bullish Scenario:
If ZEC holds above support and breaks above the $411 resistance with strong volume, it could invalidate the bearish implications of the descending triangle and mark the beginning of a new bullish expansion phase.
-
Bearish Scenario:
Failure to break resistance — or a loss of the $300–$335 support zone — could send ZEC back into consolidation or trigger another retest of lower demand levels before a clear trend emerges.
Final Outlook
Zcash is currently at a technical inflection point. The combination of strong historical support, a tightening price structure, and an early rebound off key demand levels suggests that a larger move may be approaching. Whether that move resolves higher toward $411 or lower back into support will depend on how price reacts as the descending triangle nears its apex.
For now, $325 support and $411 resistance remain the two most important levels to monitor.
Disclaimer: The views and analysis presented in this article are for informational purposes only and reflect the author’s perspective, not financial advice. Technical patterns and indicators discussed are subject to market volatility and may or may not yield the anticipated results. Investors are advised to exercise caution, conduct independent research, and make decisions aligned with their individual risk tolerance.
About Author: Nilesh Hembade is the Founder and Lead Author of Coinsprobe, with over 5 years of experience in the cryptocurrency and blockchain industry. Since launching Coinsprobe in 2023, he has been providing daily, research-driven insights through in-depth market analysis, on-chain data, and technical research.
Disclaimer: The information on this page may come from third parties and does not represent the views or opinions of Gate. The content displayed on this page is for reference only and does not constitute any financial, investment, or legal advice. Gate does not guarantee the accuracy or completeness of the information and shall not be liable for any losses arising from the use of this information. Virtual asset investments carry high risks and are subject to significant price volatility. You may lose all of your invested principal. Please fully understand the relevant risks and make prudent decisions based on your own financial situation and risk tolerance. For details, please refer to
Disclaimer.
Related Articles
Bittensor (TAO) Hits a 3-Month Peak: What Caused the Rally and What Comes Next?
Many leading cryptocurrencies have posted slight declines or negligible increases over the past 24 hours, but this isn’t the case for Bittensor (TAO), whose price soared by 15%.
The question now is whether this momentum can hold or if a pullback is coming next.
Further Gains
CryptoPotato1h ago
ETH falls 0.85% in 15 minutes: Exchange outflows and ETF trimming in sync amplify volatility
From 23:00 to 23:15 (UTC) on March 28, 2026, the price of ETH fluctuated downward within the range of 1,989.32 to 2,012.0 USDT, recording a return of -0.85%, with a volatility of 1.13%. During this period, market attention increased, and short-term fluctuations intensified, prompting traders to closely monitor the performance of key support zones.
The main driver of this volatility is the continuous outflow of ETH from major exchanges to on-chain wallets since March, with a total outflow of 31.6 million coins, leading to a contraction in exchange liquidity and causing prices to be sensitive to large orders. Meanwhile,
GateNews1h ago
Is the XRP Bottom Finally Here? 3 Massive Bullish Signals You Need to See
Although in a more modest manner, XRP whales have returned to the scene, amassing more tokens over the past week, which is categorized as the first bullish sign for the underlying asset.
Another could come in the form of the technical tool used to determine whether that asset’s move in either
CryptoPotato2h ago
Bitcoin’s Most Dangerous Pattern Just Triggered: Will BTC Dump to $26K Next?
Although bitcoin has already dumped by over 50% from its all-time high of over $126,000 marked in October to a multi-year low of $60,000, the asset’s troubles might not be over, warned Merlijn The Trader.
The popular analyst indicated that the “most dangerous bitcoin pattern just completed phase
CryptoPotato2h ago
