
Key Takeaways
-
NEAR is forming a potential double bottom pattern near the $1.40 support zone.
-
Holding above $1.40 keeps the bullish reversal scenario intact.
-
A breakout above $1.87 could confirm the pattern and trigger a stronger recovery.
The broader cryptocurrency market has once again slipped into a corrective phase after a strong start to the year. Bitcoin (BTC), which recently surged above the $95,000 mark, has pulled back sharply and is now trading below $88,000. Ethereum (ETH) has faced even heavier pressure, sliding nearly 10% over the past week — a move that has weighed on major altcoins across the board.
Near Protocol (NEAR) hasn’t been spared either. The token is currently down around 6% on the week. However, beneath the surface, NEAR’s price action is beginning to show a familiar and potentially bullish setup — one that could hint at a bounce back if key levels hold.
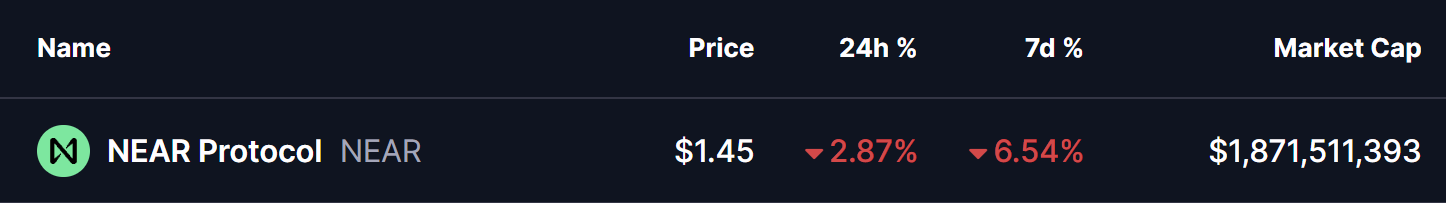
Source: Coinmarketcap
Double Bottom Pattern in Play?
On the daily timeframe, NEAR appears to be forming a potential double bottom pattern, a well-known bullish reversal structure that often emerges near the end of extended downtrends.
The first bottom formed when NEAR dropped toward the $1.40 region, followed by a recovery attempt that pushed price back toward the neckline resistance around $1.87. That move, however, faced rejection, sending NEAR back down to retest the same $1.40 support zone.
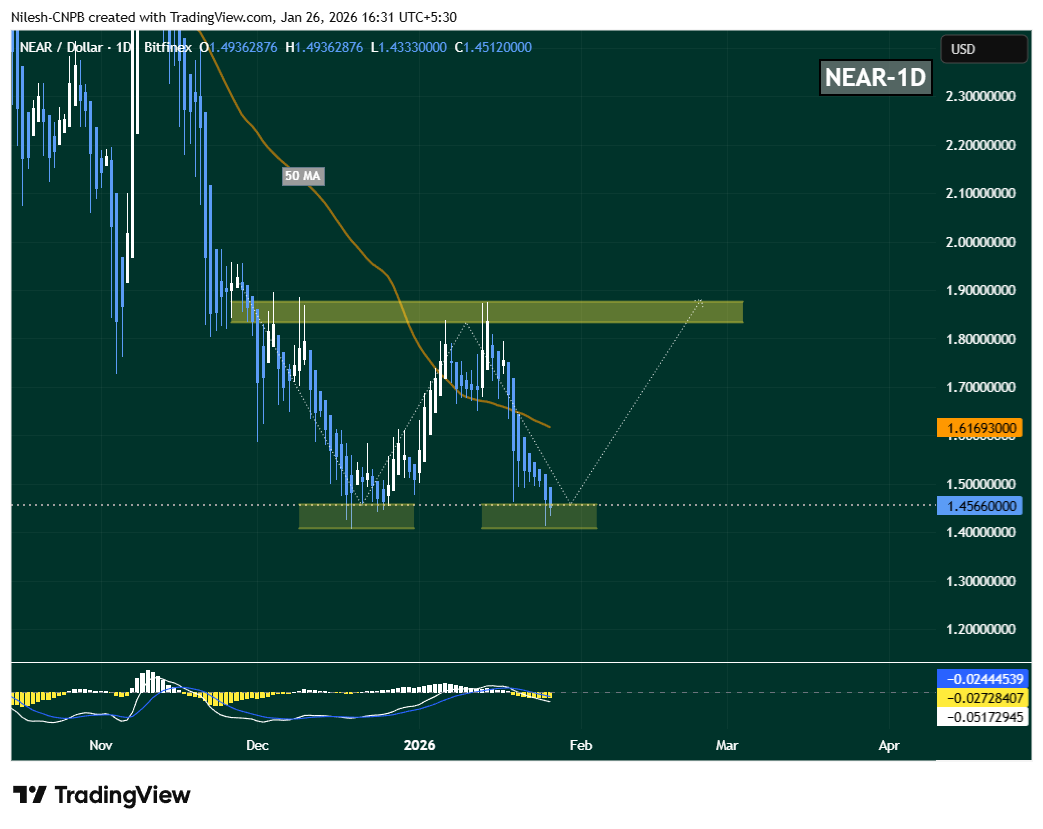
Near Protocol (NEAR) Daily Chart/Coinsprobe (Source: Tradingview)
What stands out is that buyers stepped in once again at this level. NEAR has so far held above this support and is currently trading near $1.45, signaling that selling pressure may be weakening. Adding to this setup, the MACD indicator is beginning to hint at a possible bullish crossover — often an early signal that momentum could start shifting in favor of the bulls.
What’s Next for NEAR?
For this bullish structure to gain traction, NEAR needs to reclaim the 50-day moving average, which sits near $1.6169. A sustained move above this level would mark an important shift in short-term momentum and increase the odds of a continued recovery toward the neckline resistance at $1.87.
A decisive breakout above that neckline — ideally followed by a successful retest — would confirm the double bottom pattern and potentially open the door for a stronger upside move.
On the downside, the $1.40 support zone remains the most critical level to watch. A failure to hold this area would invalidate the bullish setup and expose NEAR to deeper downside risk.
Overall, NEAR’s structure appears constructive. The repeated defense of identical lows, the developing double bottom, and price hovering near the 50-day moving average suggest that the token could be approaching a pivotal moment — one where accumulation transitions into a potential recovery phase if broader market conditions stabilize.
Disclaimer: The views and analysis presented in this article are for informational purposes only and reflect the author’s perspective, not financial advice. Technical patterns and indicators discussed are subject to market volatility and may or may not yield the anticipated results. Investors are advised to exercise caution, conduct independent research, and make decisions aligned with their individual risk tolerance.
About Author: Nilesh Hembade is the Founder and Lead Author of Coinsprobe, with over 5 years of experience in the cryptocurrency and blockchain industry. Since launching Coinsprobe in 2023, he has been providing daily, research-driven insights through in-depth market analysis, on-chain data, and technical research.
Disclaimer: The information on this page may come from third parties and does not represent the views or opinions of Gate. The content displayed on this page is for reference only and does not constitute any financial, investment, or legal advice. Gate does not guarantee the accuracy or completeness of the information and shall not be liable for any losses arising from the use of this information. Virtual asset investments carry high risks and are subject to significant price volatility. You may lose all of your invested principal. Please fully understand the relevant risks and make prudent decisions based on your own financial situation and risk tolerance. For details, please refer to
Disclaimer.
Related Articles
Today’s Crypto Fear and Greed Index has fallen to 9, and the market is in extreme fear.
Gate News message, March 29, according to data from Alternative.me, today the Crypto Fear & Greed Index has fallen to 9, down further from yesterday’s 12, and the market is still in an “extreme fear” state.
GateNews2m ago
Bittensor (TAO) Hits a 3-Month Peak: What Caused the Rally and What Comes Next?
Many leading cryptocurrencies have posted slight declines or negligible increases over the past 24 hours, but this isn’t the case for Bittensor (TAO), whose price soared by 15%.
The question now is whether this momentum can hold or if a pullback is coming next.
Further Gains
CryptoPotato1h ago
ETH falls 0.85% in 15 minutes: Exchange outflows and ETF trimming in sync amplify volatility
From 23:00 to 23:15 (UTC) on March 28, 2026, the price of ETH fluctuated downward within the range of 1,989.32 to 2,012.0 USDT, recording a return of -0.85%, with a volatility of 1.13%. During this period, market attention increased, and short-term fluctuations intensified, prompting traders to closely monitor the performance of key support zones.
The main driver of this volatility is the continuous outflow of ETH from major exchanges to on-chain wallets since March, with a total outflow of 31.6 million coins, leading to a contraction in exchange liquidity and causing prices to be sensitive to large orders. Meanwhile,
GateNews1h ago
Is the XRP Bottom Finally Here? 3 Massive Bullish Signals You Need to See
Although in a more modest manner, XRP whales have returned to the scene, amassing more tokens over the past week, which is categorized as the first bullish sign for the underlying asset.
Another could come in the form of the technical tool used to determine whether that asset’s move in either
CryptoPotato2h ago
Bitcoin’s Most Dangerous Pattern Just Triggered: Will BTC Dump to $26K Next?
Although bitcoin has already dumped by over 50% from its all-time high of over $126,000 marked in October to a multi-year low of $60,000, the asset’s troubles might not be over, warned Merlijn The Trader.
The popular analyst indicated that the “most dangerous bitcoin pattern just completed phase
CryptoPotato2h ago
