Solana price drift followed a clear structure that had already been mapped out on higher time frames. That structure is now shaping the next phase for SOL price, and the latest chart shared by Crypto Patel on X explains why this zone matters a lot.
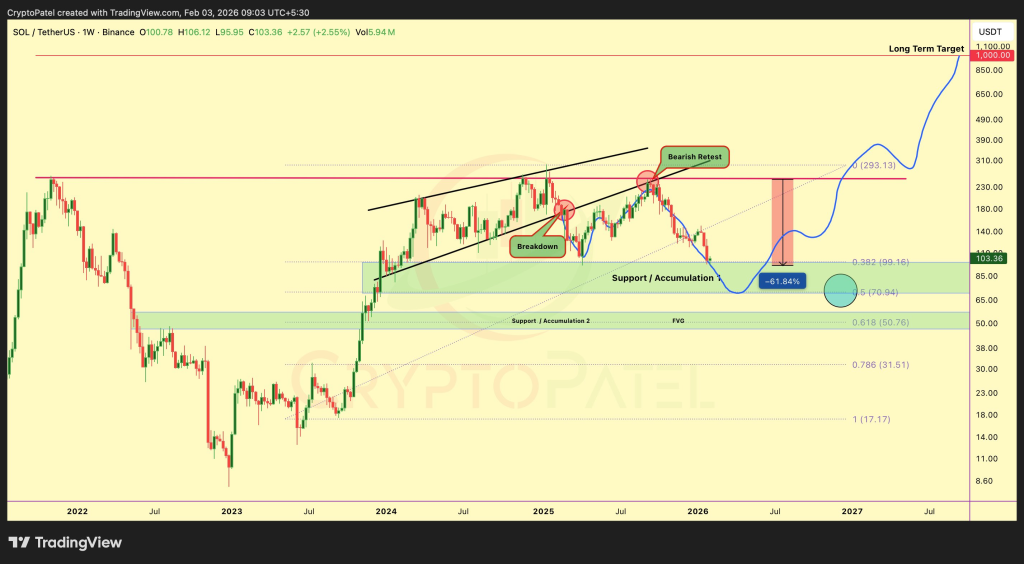
Solana spent months climbing inside a rising channel before price action started to lose balance near $230. Crypto Patel noted that region as a critical decision zone, where upside strength began to fade and sellers slowly took control. The chart shows repeated failures near the channel top, followed by a clean loss of trend support. That loss changed the entire rhythm of SOL price.
Once the structure broke, Solana price rolled over in stages rather than collapsing in a single move. Each bounce failed lower, which confirmed that momentum had already shifted. SOL eventually slid toward the $95 area. It lands close to a 60% drawdown from the peak.
@CryptoPatel / X
SOL Price Forecast: Trading Inside A Clear Accumulation Zone
Current Solana price action sits inside what Crypto Patel labels as accumulation territory. The chart highlights a green support band stretching roughly between $99 and $71. This zone lines up with prior consolidation ranges and key Fibonacci retracement levels. Buyers defended this area in the past, and price memory tends to matter in markets like this.
SOL price reaching this region did not happen after a panic spike. The weekly structure shows price slowing down rather than accelerating lower. Crypto Patel notes that this behavior often signals absorption rather than distribution. Selling pressure appears to be getting met instead of expanding.
Deeper SOL Price Levels Still Exist If Weakness Continues
The chart also maps a secondary zone lower on the range. That area sits between $57 and $46 and aligns with deeper historical demand. Crypto Patel describes this region as a potential final base if broader market conditions stay heavy. Solana price has not reached that level yet, though the roadmap is visible if support fails above.
Nothing on the chart suggests a straight line move in either direction. Price could spend time moving sideways as liquidity builds. That process often feels slow and uncomfortable, though it plays a role in resetting long term structure for assets like Solana.
Here’s How Chainlink (LINK) Solved the “Pricing Blind Spot” for RWA Markets_**
Crypto Patel stays clear that the current phase does not cancel the larger Solana story. The long term curve on the chart projects higher price levels once accumulation completes. That projection stretches toward previous highs and beyond, though timing remains open ended. SOL price needs patience here more than speed.
Disclaimer: The information on this page may come from third parties and does not represent the views or opinions of Gate. The content displayed on this page is for reference only and does not constitute any financial, investment, or legal advice. Gate does not guarantee the accuracy or completeness of the information and shall not be liable for any losses arising from the use of this information. Virtual asset investments carry high risks and are subject to significant price volatility. You may lose all of your invested principal. Please fully understand the relevant risks and make prudent decisions based on your own financial situation and risk tolerance. For details, please refer to
Disclaimer.
Related Articles
Solana Price at $80 and Maxis Are Nowhere to Be Found – Analyst Says That Tells You Everything
Solana is down to $82 on the weekly chart. From the highs near $250, that’s a 77% drop. Crypto Patel asks “Where Are All The Solana Maxis Now?.” They told their followers to buy above $250, and screamed “to the moon” at the all-time high. Now the price is $80, and they’re silent. Not a single t
CaptainAltcoin3h ago
Base58 Labs’ BASIS 2026 Blueprint Forges a New Standard for BTC, ETH, SOL & PAXG
[PRESS RELEASE – London, UK, March 17th, 2026]
New roadmap positions BASIS as an institutional-grade digital asset management platform built for macro volatility, tokenized safe-haven demand, and frictionless Web3 onboarding.
Base58 Labs today unveiled the BASIS 2026 Technical Blueprint &
CryptoPotato5h ago
Solana and TRON Trend Down While BlockchainFX Secures AOFA License—Why This $15M Launch Is The Top Crypto To Buy In 2026
The global market is shifting as traditional finance and digital assets finally collide in a massive way. While old-school giants are seeing heavy corrections on the daily charts, savvy early adopters are rotating capital into high-utility platforms. If you are searching for the top crypto to b
CaptainAltcoin6h ago
Solana Holds Near $93 as Weak Volume Clouds Breakout Outlook
Key Insights
Solana trades near $93 within a narrow range as neutral indicators and weak volume highlight indecision and limit conviction in short-term price direction.
Key resistance near $94.81 and support around $81.78 define the range, with breakouts likely to trigger stronger
CryptoNewsLand6h ago
Solana Slips Below Key Support as ETF Flows Turn Negative
Key Insights:
Solana fell below a six-week trendline, shifting focus toward 85 dollars support and a potential move to $67.44 if weakness continues
Exchange outflows reached over 39 million dollars in three days, signaling reduced sell pressure while also tightening liquidity during price v
CryptoNewsLand7h ago
The median holding time for Solana full pool tokens dropped from 1 day to 60 seconds within 750 days.
Gate News reports that on March 28, according to Dune data, the median holding time for Solana's entire pool tokens has significantly decreased over the past 750 days: approximately 1 day in 2024 (peaking over 100,000 seconds), dropping to about 100 seconds in 2025, and further decreasing to around 60 seconds in early 2026.
GateNews13h ago
