
Key Takeaways
-
Monad (MON) has dropped nearly 41% over the past two months but is showing early signs of stabilization.
-
Price action suggests a potential double bottom pattern forming near the $0.018 support zone.
-
Buyers have repeatedly defended the same support level, hinting at fading selling pressure.
-
A move above the 50-day moving average could strengthen the short-term bullish outlook.
-
A confirmed breakout above the $0.02970 neckline may open the door for a stronger recovery rally.
Monad (MON), the native token of the Monad Layer-1 blockchain, has been under pressure in recent weeks. The token is down roughly 41% over the past 60 days, driven by a slowdown in TVL growth and a decline in application-level revenue across the ecosystem.
However, sentiment may be starting to shift. MON posted a 12% bounce today, and more importantly, its price structure on the daily chart is beginning to show early signs of a bullish reversal — suggesting the downside momentum could be losing steam.
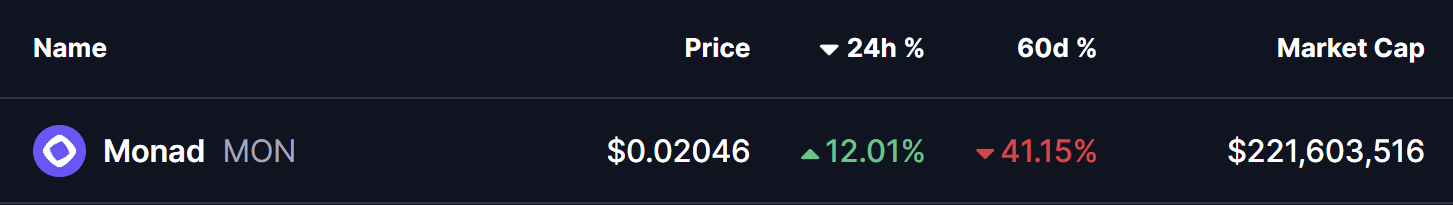
Source: Coinmarketcap
Double Bottom Pattern in Play
On the daily timeframe, MON appears to be forming a potential double bottom pattern, a classic bullish reversal structure that often develops near the end of extended downtrends.
The first bottom was formed when MON dropped toward the $0.018 support zone, followed by a rebound that carried price back toward the neckline resistance near $0.02970. That recovery attempt was rejected, sending MON back down to retest the same support level.
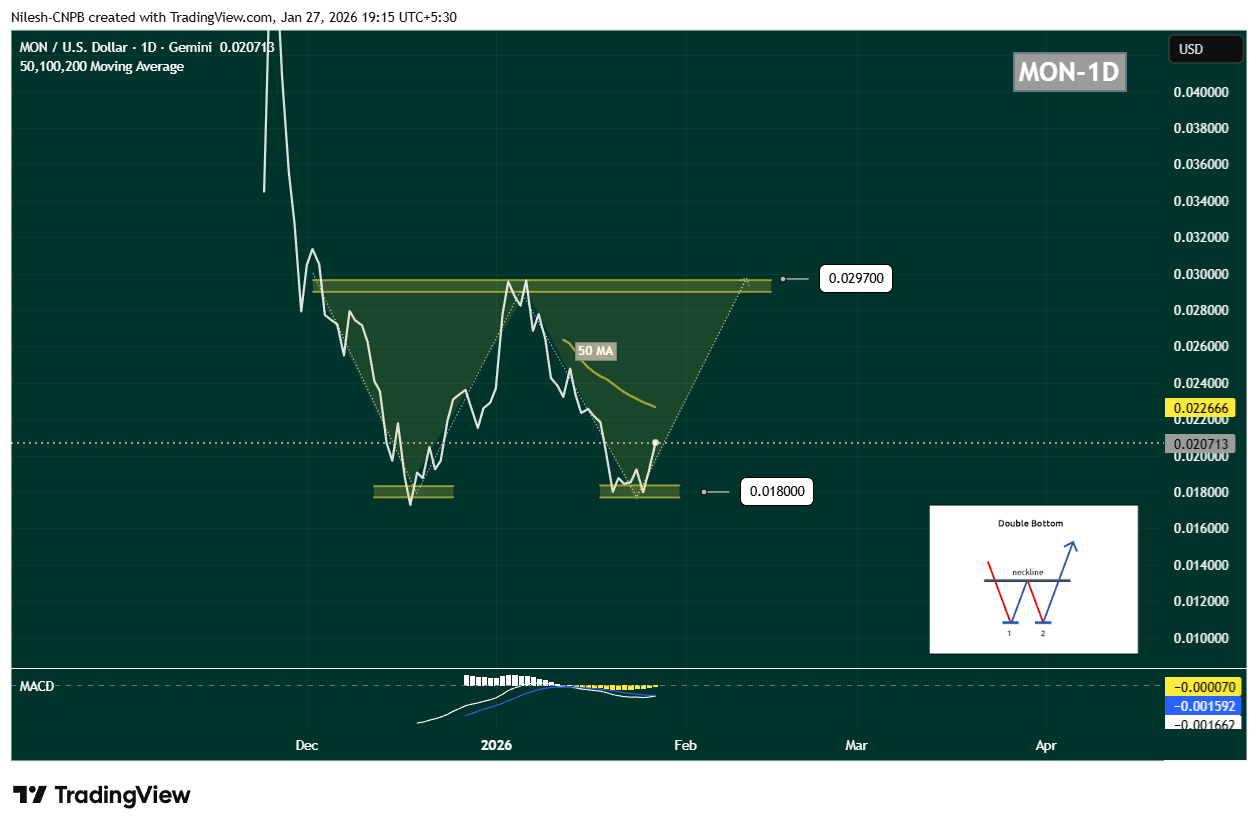
Monad (MON) Daily Chart/Coinsprobe (Source: Tradingview)
What’s notable this time is buyer behavior. Once again, demand emerged around $0.018, preventing a breakdown and forming the second bottom of the structure. MON is currently trading near $0.02071, indicating that selling pressure may be fading.
Momentum indicators are starting to support this view. The MACD is showing early signs of a potential bullish crossover, often seen as an initial signal that downside momentum is weakening and buyers may be preparing to step back in.
What’s Next for Monad (MON)?
For this bullish setup to gain credibility, MON needs to reclaim the 50-day moving average, which is currently positioned near $0.02266. A sustained move above this level would signal a shift in short-term momentum and improve the probability of a recovery rally.
If buyers manage to push price back toward the $0.02970 neckline, the market will be watching closely. A decisive breakout above this resistance, ideally followed by a successful retest, would confirm the double bottom pattern and open the door for a stronger upside move.
On the downside, the $0.018 support zone remains the most critical level to defend. A breakdown below this area would invalidate the bullish structure and likely expose MON to another leg of downside or extended consolidation.
Bottom Line
Despite recent weakness, MON’s technical structure is starting to look constructive. The repeated defense of identical lows, the emergence of a double bottom pattern, and improving momentum signals suggest that Monad could be approaching a potential turning point.
If key support continues to hold and the token reclaims its short-term moving averages, MON may be setting the stage for a recovery phase — especially if broader market conditions stabilize in the days ahead.
Disclaimer: The views and analysis presented in this article are for informational purposes only and reflect the author’s perspective, not financial advice. Technical patterns and indicators discussed are subject to market volatility and may or may not yield the anticipated results. Investors are advised to exercise caution, conduct independent research, and make decisions aligned with their individual risk tolerance.
About Author: Nilesh Hembade is the Founder and Lead Author of Coinsprobe, with over 5 years of experience in the cryptocurrency and blockchain industry. Since launching Coinsprobe in 2023, he has been providing daily, research-driven insights through in-depth market analysis, on-chain data, and technical research.
Disclaimer: The information on this page may come from third parties and does not represent the views or opinions of Gate. The content displayed on this page is for reference only and does not constitute any financial, investment, or legal advice. Gate does not guarantee the accuracy or completeness of the information and shall not be liable for any losses arising from the use of this information. Virtual asset investments carry high risks and are subject to significant price volatility. You may lose all of your invested principal. Please fully understand the relevant risks and make prudent decisions based on your own financial situation and risk tolerance. For details, please refer to
Disclaimer.
Related Articles
XRP tests $1.33 as rising leverage and weak price action create unstable setup
XRP remains near $1.33, experiencing a fragile market with rising leverage and failed upward momentum. Traders should watch for breaks below $1.33 or reclaiming $1.35-$1.36 to assess future direction.
CoinDesk9m ago
Bittensor ecosystem reaches $1.5 billion as TAO surges thanks to the Jensen Huang effect.
Bittensor's TAO has seen a significant increase this month, driving the value of its subnet tokens up. With a total market cap of about $1.47 billion, it operates as a decentralized AI network. Notable endorsements from Nvidia's CEO have heightened interest, raising questions about the sustainability of this growth.
TapChiBitcoin12m ago
VRA Soars Past $0.000044 — 24.57% Surge Catches Traders Off Guard
VRA's price surged 24.57% in five minutes to $0.000044, driven by whale activity and increased market sentiment. With a trading volume of over $33.7 billion, traders are monitoring key resistance and support levels for future movements.
Coinfomania47m ago
Solana challenges Ethereum: Can the SOL/ETH pair reclaim the 0.05 mark in Q2?
The long-term growth of a blockchain network is always tied to the size of the developer ecosystem. As more and more developers join in building, the pace of infrastructure upgrades accelerates, which in turn attracts more users to layer 1 (L1), increases on-chain activity, and boosts the network’s overall value.
TapChiBitcoin48m ago
Bitcoin may record its second consecutive six-month decline in history, following its first consecutive six-month drop, after which it surged by 208%.
BlockBeats news, on March 29, according to Coinglass data, Bitcoin's return rate for March this year is currently reported at -0.76%, which may mark the sixth consecutive month of decline.
Historically, Bitcoin has only experienced a similar situation once: from August 2018 to January 2019, it fell approximately 54.8% over six months. Subsequently, Bitcoin saw a continuous rise for five months (from February 2019 to June 2019), with a total increase of up to 208%.
BlockBeatNews1h ago
Altcoin XRP Makes Bullish Breakout Against Bitcoin, Projecting a Possible Massive Surge Ahead
Altcoin XRP makes bullish breakout against Bitcoin (BTC).
The asset is projected towards hitting bullish new ATH prices.
The price of XRP could surge over 600% to hit ATH targets over $10.
The crypto market prepares to see Bitcoin (BTC) make its sixth consecutive red close, a pattern
CryptoNewsLand1h ago
