
Key Takeaways
-
Ethereum ($ETH) has broken below the critical $2,637 support, signaling a shift in short-term market structure.
-
Price is now trading near $2,400, posting an 11.10% daily loss and a 18% year-to-date decline.
-
The current price action mirrors a bearish fractal from August 2024, raising the risk of further downside.
-
If selling pressure persists, ETH could slide toward the $2,128 support zone, where buyers may attempt a defense.
Ethereum ($ETH), the second-largest cryptocurrency by market capitalization, is once again under heavy selling pressure. As of January 31, 2026, ETH has slipped near the $2,400 mark, printing an 11.10% decline in the last 24 hours and extending its year-to-date losses to 18.73%, while also marking a fresh yearly low.
The sharp move lower has shifted short-term sentiment firmly in favor of the bears, with both price structure and derivatives data flashing warning signs.
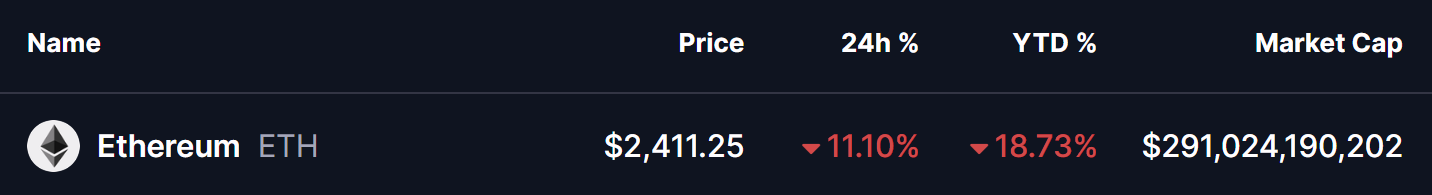
Source: Coinmarketcap
Liquidations Soar as Bulls Get Trapped
The downside move has been amplified by aggressive liquidations across the derivatives market. Recent data shows over $553 million worth of ETH positions liquidated, with a striking $523 million coming from long positions, compared to just $30 million in shorts over the past 24 hours.
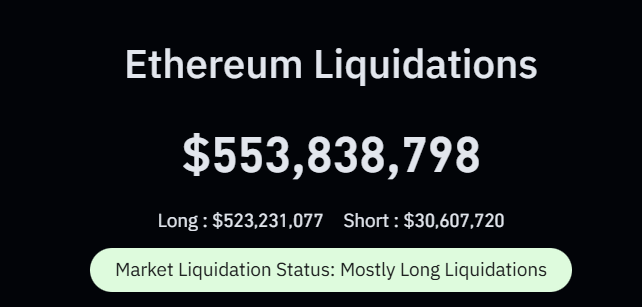
Ethereum (ETH) Liquidations/Source: Coinglass
This imbalance highlights a classic scenario of over-leveraged bulls getting flushed out, where forced sell orders accelerate downside momentum. When liquidations skew this heavily toward longs, price often struggles to find immediate relief, as dip buyers hesitate and momentum traders press their advantage.
Bears Take Control on the Daily Chart
From a technical perspective, Ethereum’s daily chart paints a concerning picture. ETH has decisively lost the $2,637 horizontal support, a level that previously acted as a floor during consolidation. Once this zone gave way, selling pressure intensified, dragging price swiftly toward the $2,400 region.
What makes this move particularly notable is its resemblance to a previous downside fractal visible on the chart. Back in August 2024, ETH broke a similar support structure, triggering a sharp continuation move that ultimately drove price into a deeper corrective phase before buyers finally stepped in.
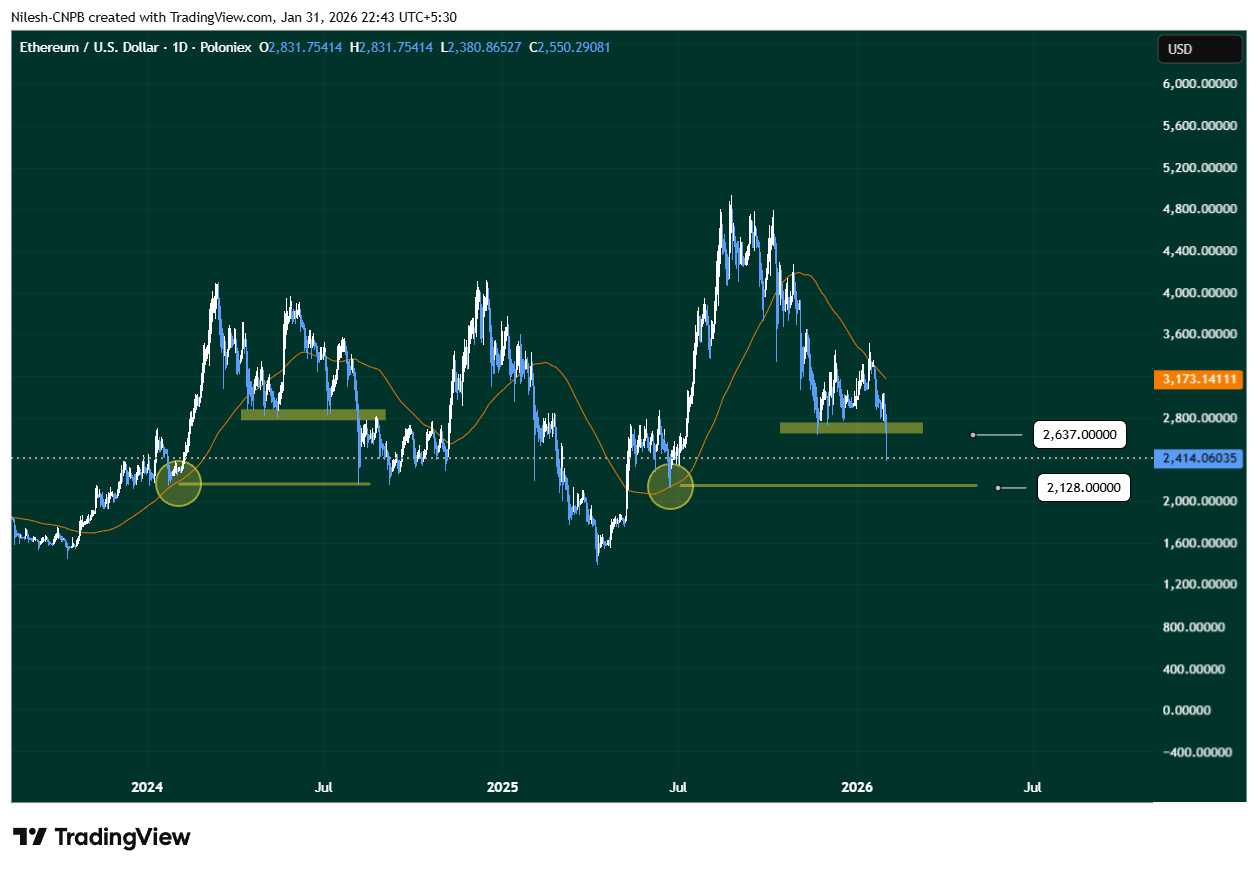
Ethereum (ETH) Daily Chart/Coinsprobe (Source: Tradingview)
The current structure appears to be echoing that same behavior—support break, rapid downside expansion, and limited bounce attempts so far.
More Pain Ahead?
If this historical fractal continues to play out, Ethereum could be heading toward its next major support near $2,128, a zone that previously attracted strong demand. This level stands out as a potential area where longer-term buyers may begin to show interest, especially if broader market conditions stabilize.
On a flip side, a strong reclaim of the $2,637 resistance zone, followed by acceptance above it, would invalidate the current fractal setup and suggest that today’s breakdown was a false move. Such a recovery would likely force late shorts to cover and could stabilize price action.
For now, however, Ethereum remains vulnerable. With heavy long liquidations, broken support, and a familiar bearish pattern resurfacing on the chart, the path of least resistance appears tilted to the downside—at least in the short term.
Disclaimer: The views and analysis presented in this article are for informational purposes only and reflect the author’s perspective, not financial advice. Technical patterns and indicators discussed are subject to market volatility and may or may not yield the anticipated results. Investors are advised to exercise caution, conduct independent research, and make decisions aligned with their individual risk tolerance.
About Author: Nilesh Hembade is the Founder and Lead Author of Coinsprobe, with over 5 years of experience in the cryptocurrency and blockchain industry. Since launching Coinsprobe in 2023, he has been providing daily, research-driven insights through in-depth market analysis, on-chain data, and technical research.
Disclaimer: The information on this page may come from third parties and does not represent the views or opinions of Gate. The content displayed on this page is for reference only and does not constitute any financial, investment, or legal advice. Gate does not guarantee the accuracy or completeness of the information and shall not be liable for any losses arising from the use of this information. Virtual asset investments carry high risks and are subject to significant price volatility. You may lose all of your invested principal. Please fully understand the relevant risks and make prudent decisions based on your own financial situation and risk tolerance. For details, please refer to
Disclaimer.
Related Articles
ETH breaks through 2300 USDT, up 2.48% over the past 24 hours
Gate News message, April 11, according to market data, ETH breaks through 2300 USDT, currently reported at 2300.09 USDT, with a 24-hour increase of 2.48%.
GateNews44m ago
ETH 15-minute surge of 1.44%: ETF inflows returning and short liquidations triggering a quick spike
From 2026-04-11 18:30 to 2026-04-11 18:45 (UTC), ETH’s 15-minute return recorded +1.44%, with a price range of 2263.12 to 2312.65 USDT and a range amplitude of 2.19%. After a surge with heavy short-term volume, market attention rose rapidly, and volatility increased significantly.
The main driving force behind this move is a strong reversal in ETF fund flows and a synchronized liquidation of derivatives market shorts. Specifically, on April 10, the ETH spot ETF recorded a net inflow of $114 million—its largest in three months—
GateNews58m ago
ETH breaks through 2300 USDT
Gate News bot message, Gate market shows, ETH breaks through 2300 USDT, current price is 2300.6 USDT.
CryptoRadar1h ago
ETH 15-minute rally up 0.70%: Shorts liquidated and on-chain capital inflows converge to lift prices
2026-04-11 16:30 to 16:45 (UTC), ETH’s return rate was +0.70% within 15 minutes, with a price range of 2246.84 - 2273.89 USDT and a swing of 1.20%. During this period, market attention increased, with on-chain activity and trading volume rising in tandem, and volatility amplifying in the short term.
The main driving factor behind this abnormal move is that short-side funds in the derivatives market were forced to stop losses. According to data across the network, the funding rate was -0.002%, indicating short positions have the upper hand; however, the ETH short liquidation amount ($8.89M) was significantly higher than
GateNews2h ago
BlackRock withdrew 2,700 BTC and 30k ETH from a certain CEX
Gate News message: On April 11, according to monitoring by Onchain Lens, BlackRock withdrew 2,700 BTC (worth $196.87 million) and 30,000 ETH (worth $67.42 million) from a certain CEX.
GateNews3h ago
Ethereum co-founder Joe Lubin: The Ethereum Strategy mode can enable better allocation through staking rewards
Bitmine chairman Tom Lee shares Joe Lubin’s interview, discussing Ethereum’s potential. Joe Lubin points out that earning yield through staking ETH, compared with Bitcoin, allows Ethereum to achieve higher asset appreciation and drive a transition in its profit model.
GateNews10h ago
