
Key Takeaways
-
Ethereum has pulled back below $2,900, but large whales and institutions are actively buying the dip.
-
ETH’s chart is forming a bullish Shark harmonic pattern, often seen near potential market bottoms.
-
Holding above the $2,784 support keeps the rebound scenario alive, with $3,062 as the first upside target.
The broader cryptocurrency market has once again turned lower after a strong start to the year that pushed Ethereum (ETH) above the $3,400 mark. Since then, sentiment has cooled, with ETH sliding below $2,900 and posting a decline of over 9% in the past week as risk appetite across the market weakened.
Despite the short-term pullback, activity beneath the surface tells a more nuanced story. Recent whale and institutional movements, combined with Ethereum’s evolving chart structure, suggest that selling pressure may be slowing — and a rebound could be starting to take shape.
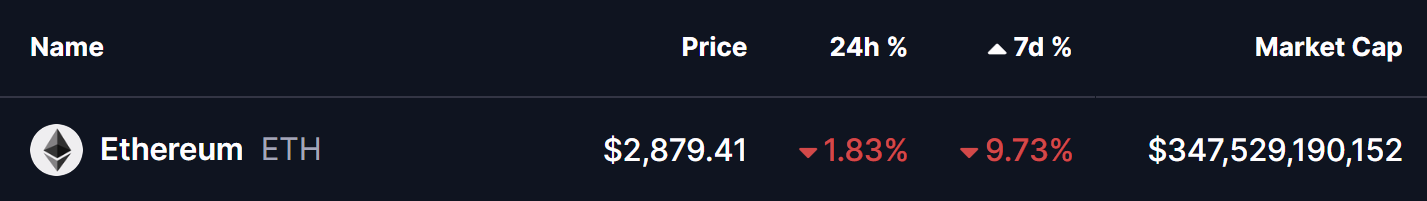
Source: Coinmarketcap
Whales and Institutions Step In on the Ethereum Dip
According to the latest on-chain data shared by Lookonchain, large players have been actively accumulating ETH during this market dip.
As prices fell, an OTC whale address (0xFB7) added another 20,000 ETH worth approximately $56.13 million just six hours ago. Over the past five days alone, this same whale has accumulated a massive 70,013 ETH, totaling roughly $203.6 million — a strong signal of confidence at current price levels.
At the same time, institutional rotation appears to be underway. World Liberty Finance (WLFI) has begun shifting exposure away from Bitcoin and into Ethereum. Around six hours ago, the fund swapped 93.77 WBTC (valued at $8.08 million) for 2,868 ETH, reinforcing the view that larger players see value emerging in ETH after the recent correction.
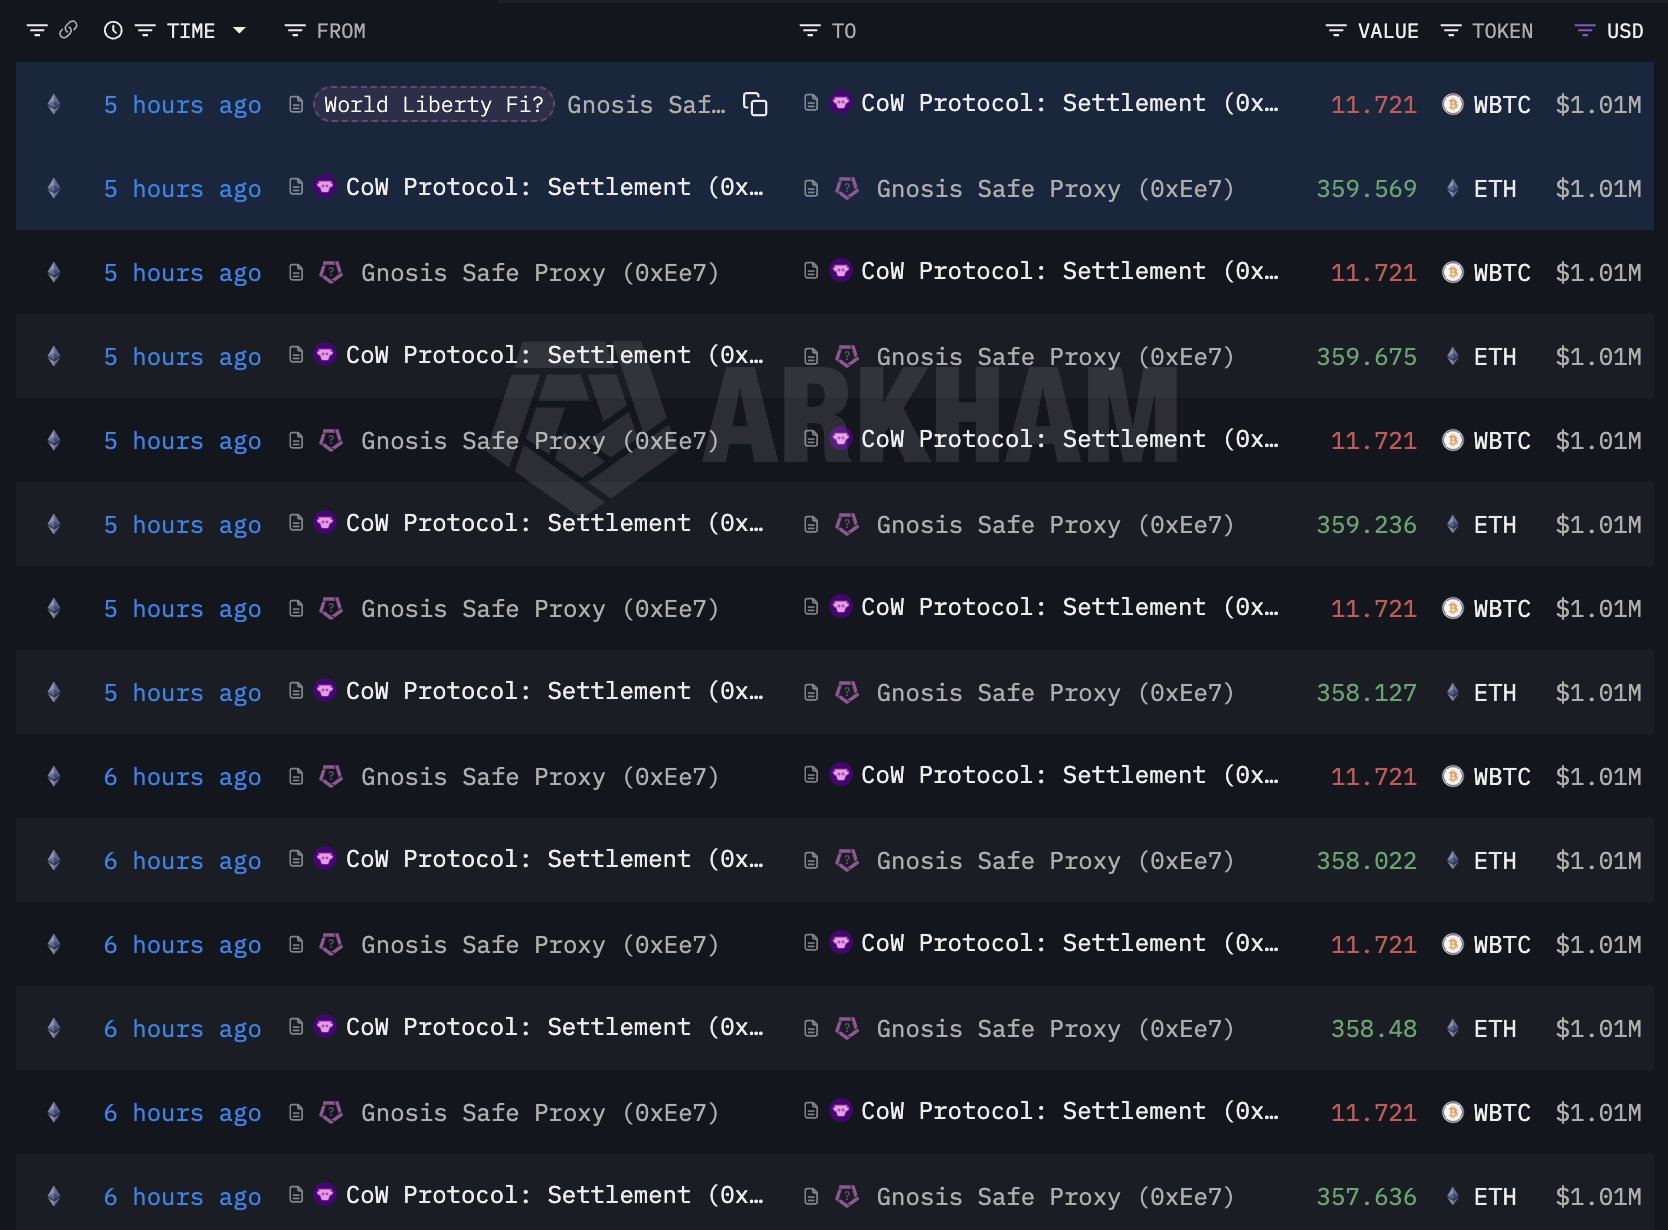
Source: @lookonchain (X)
Harmonic Pattern Signals a Possible Rebound
From a technical perspective, Ethereum’s 4-hour chart is flashing a potentially constructive setup. ETH appears to be completing a Bullish Shark harmonic pattern, a structure that often forms near market lows when downside momentum becomes exhausted.
The pattern began with the initial O–X move around the $2,908 region, followed by a sharp rally toward point X near $3,306. Price then retraced aggressively toward point A before making another push higher, forming point B close to $3,406. However, that advance failed to hold, leading to a renewed sell-off that appears to have completed point C near $2,784.
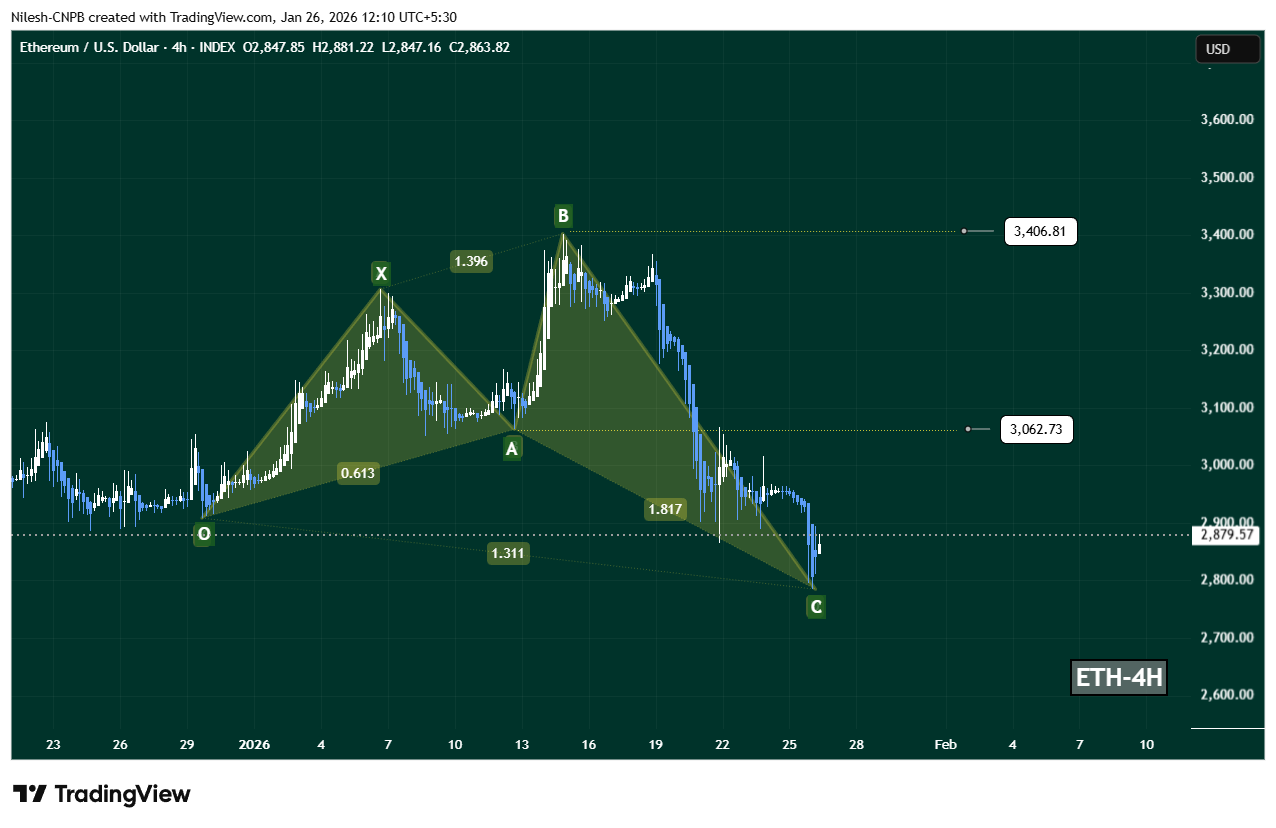
Ethereum (ETH) 4H Chart/Coinsprobe (Source: Tradingview)
This C-leg zone is considered the potential reversal area in a Shark pattern. Notably, after touching this region, ETH has already shown early signs of stabilization, bouncing back toward the $2,880 area — an initial response that suggests selling pressure may be weakening.
What’s Next for ETH?
If the harmonic structure continues to play out, Ethereum could be positioning for a short-term rebound from current levels. The first upside area to watch sits around $3,062, which aligns closely with the prior A-point and acts as a key recovery level.
A stronger bullish follow-through could eventually bring the $3,406 region back into focus — the B-leg high and a major resistance zone where sellers previously stepped in.
That said, this bullish scenario remains conditional. A sustained breakdown below the $2,784 support zone would invalidate the Shark pattern and tilt momentum back in favor of the bears, potentially opening the door for deeper downside continuation.
Bottom Line
While Ethereum’s price has cooled sharply after its early-year rally, whale accumulation and institutional rotation suggest growing confidence at current levels. Combined with a developing bullish Shark harmonic pattern on the 4-hour chart, ETH may be entering a stabilization phase that could precede a rebound.
However, confirmation is still needed. As long as ETH holds above the $2,784 zone, the technical and on-chain signals lean cautiously bullish — but a failure to defend this level would shift the outlook back to the downside.
Disclaimer: The views and analysis presented in this article are for informational purposes only and reflect the author’s perspective, not financial advice. Technical patterns and indicators discussed are subject to market volatility and may or may not yield the anticipated results. Investors are advised to exercise caution, conduct independent research, and make decisions aligned with their individual risk tolerance.
About Author: Nilesh Hembade is the Founder and Lead Author of Coinsprobe, with over 5 years of experience in the cryptocurrency and blockchain industry. Since launching Coinsprobe in 2023, he has been providing daily, research-driven insights through in-depth market analysis, on-chain data, and technical research.
Disclaimer: The information on this page may come from third parties and does not represent the views or opinions of Gate. The content displayed on this page is for reference only and does not constitute any financial, investment, or legal advice. Gate does not guarantee the accuracy or completeness of the information and shall not be liable for any losses arising from the use of this information. Virtual asset investments carry high risks and are subject to significant price volatility. You may lose all of your invested principal. Please fully understand the relevant risks and make prudent decisions based on your own financial situation and risk tolerance. For details, please refer to
Disclaimer.
Related Articles
TD Cowen Cuts Strategy Target but Starts Sharplink at Buy on Ethereum Treasury Model
TD Cowen adjusted its price target for Bitcoin-focused Strategy while maintaining a positive outlook, contrasting it with its new buy rating for Ethereum-based Sharplink, which offers a more active digital asset growth model through staking.
CryptoNewsFlash49m ago
ETH 15-minute drop of 0.66%: short-term holders selling off in tandem with exchange net inflows amplifies the selling pressure
2026-04-12 22:00 to 22:15 (UTC), ETH showed a clear downward move in a highly liquid environment. The candlestick chart indicates a return of -0.66%, with price fluctuations ranging from 2186.76 to 2211.25 USDT, and a swing amplitude of 1.11%. Market attention rose rapidly, short-term sentiment turned cautious, and volatility intensified.
The main driving factors behind this unusual move are a sharp increase in exchange net inflows and concentrated selling by short-term holders. On-chain data shows that over the past 24 hours, net inflow of ETH into exchanges totaled 9,567.65 ETH, suggesting that a large amount of capital entered the market in the short term, potentially increasing selling pressure.
GateNews1h ago
ETH 15-minute rise of 0.68%: ETF inflows and active on-chain capital align to drive a price recovery
2026-04-12 20:30 to 2026-04-12 20:45 (UTC), the ETH price surged quickly within the range of 2197.57 to 2218.26 USDT. The 15-minute return recorded +0.68%, and the range reached 0.94%. During the event window, market attention increased; short-term volatility intensified, drawing investors to focus on on-chain fund movements and the direction of mainstream capital flows.
The main driver behind this deviation is the significant inflow of ETF and institutional-type capital. Since the beginning of April, ETH-related ETFs have accumulated a net inflow of $114.66 million, total
GateNews2h ago
ETH breaks through 2200 USDT, with the 24-hour drop narrowing to 2.67%
Gate News message, April 12, market data shows that ETH broke through 2200 USDT, now reported at 2200.3 USDT, and the 24-hour decline has narrowed to 2.67%.
GateNews5h ago
Ethereum falls below $2,200; 24-hour drop of 1.86%
Gate News message, April 12, market data shows that Ethereum has fallen below the $2,200 level, with a 24-hour drop of 1.86%.
GateNews12h ago
