
Gold pushed above $5,300 per ounce for the first time in history, which is a new record during a week when risk assets were under pressure. Bitcoin dipped below $88,000 earlier in the week but quickly stabilized, now trading just under $90,000. The key point is not the intraday volatility, but the fact that Bitcoin held structure while gold made a historic extension.
This exact relationship is what analyst Sykodelic showed in his recent chart. The visual compares three markets side by side on a monthly timeframe: gold, Bitcoin, and the BTC/GOLD ratio. When aligned, the sequence across cycles becomes very clear.
Start with gold. In both 2016 and 2021, gold entered a strong directional move first. Those rallies were persistent, lasted months, and ended with exhaustion near cycle highs. During those same periods, Bitcoin did not trend aggressively. Instead, it moved sideways, forming broad ranges with declining volatility. That consolidation phase is visible again now.
Next is the BTC/GOLD ratio, which matters more than either asset alone. In prior cycles, the ratio stalled while gold rallied. It chopped inside defined boxes, showing that Bitcoin was not outperforming gold during that phase. Only after gold topped did the ratio reverse higher, marking the start of Bitcoin’s relative strength phase.
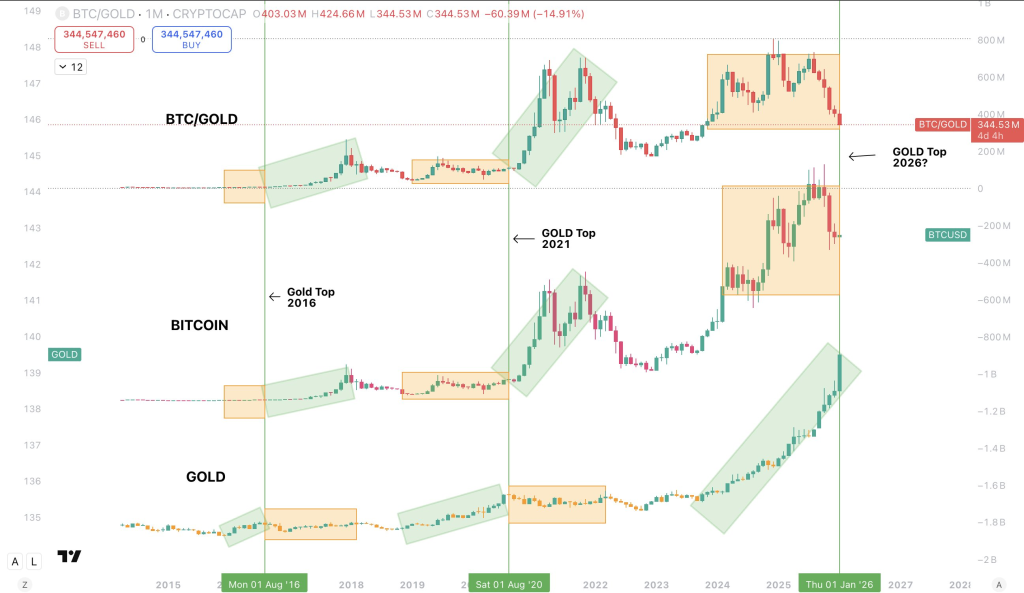
**Source: X/@Sykodelic**_
The current BTC/GOLD structure matches that behavior closely. The ratio has rolled over from recent highs and is now compressing inside a range, almost identical to the consolidation zones seen before the 2016 and 2021 Bitcoin expansions. This is the same pause that occurred before Bitcoin’s largest upside moves.
Bitcoin’s own chart supports that interpretation. In both prior cycles, Bitcoin formed rising bases while gold peaked. Price action was uneven and frustrating, but downside was limited. That is what is happening now. Despite sharp headlines around metals and macro stress, Bitcoin has not lost its higher-timeframe support or entered a sustained downtrend.
What this chart does not show is Bitcoin collapsing alongside gold. That narrative has appeared many times in the past and failed each time. Historically, Bitcoin has not followed gold lower after major gold tops. Instead, capital rotated out of metals and into Bitcoin once gold’s trend matured.
The key takeaway from Sykodelic’s chart is timing, not prediction. Gold leads first. Bitcoin waits. Then leadership flips.
Gold reaching $5,300 does not invalidate Bitcoin’s cycle. If anything, the historical pattern suggests Bitcoin is still in the same pre-expansion phase seen before its previous parabolic runs. Whether gold tops this month or later is unknown, but the chart makes one point very clear: Bitcoin’s strongest moves have consistently come after gold finishes its primary rally.
That rotation, not correlation, is what the chart is showing.
Read also: Why Gold and Silver Are Exploding at the Same Time – And What It Signals for Markets
Disclaimer: The information on this page may come from third parties and does not represent the views or opinions of Gate. The content displayed on this page is for reference only and does not constitute any financial, investment, or legal advice. Gate does not guarantee the accuracy or completeness of the information and shall not be liable for any losses arising from the use of this information. Virtual asset investments carry high risks and are subject to significant price volatility. You may lose all of your invested principal. Please fully understand the relevant risks and make prudent decisions based on your own financial situation and risk tolerance. For details, please refer to
Disclaimer.
Related Articles
Bitcoin Reclaims $76,000 as US March PPI Misses Forecasts
Bitcoin surged past $76,000 following lower-than-expected US Producer Price Index data for March 2026, which indicated a 4% year-over-year increase. The rise reflects strong market support despite declining leveraged positions.
GateNews50m ago
BTC 15-minute rise of 0.64%: a technical breakout of key resistance combined with weak liquidity amplifies volatility
2026-04-14 15:30 to 15:45 (UTC), BTC saw short-term fluctuations within the 74,795.5 to 75,319.3 USDT range, with a return of +0.64% and a range of 0.70%. During this period, market attention warmed up, volatility intensified, trading volume rose slightly compared with the previous hour, and short-term buy orders pushed the price upward quickly.
The main driver of this unusual move was BTC’s short-term technical breakout above the 74,000 USDT key resistance, which generated a long signal and triggered rapid responses from quantitative and programmatic buy orders. At the same time, because the order book depth has been rising since 2025
GateNews54m ago
Bitcoin Reclaims $75,000 for Second Time Since US-Iran Conflict, Up 7% in 24 Hours
Bitcoin surged to $75,000 amid rising U.S.-Iran tensions, adding $98 billion to its market cap and causing $500 million in liquidations. Technical analysts suggest that holding support above $67,000 could lead to an increase toward $80,000, despite highlighting $50,000 as a critical level if support fails.
GateNews1h ago
BTC 跌破 75000 USDT
Gate News bot 消息,Gate 行情显示,BTC 跌破 75000 USDT,现价 74993.6 USDT。
CryptoRadar1h ago
Goldman Sachs files a Bitcoin premium income ETF application with U.S. regulators
Gate News message, according to the submitted filings, Goldman Sachs has filed an application with regulatory authorities for a Bitcoin Premium Income ETF.
GateNews1h ago
Whale "pension-usdt.eth" Faces $11.7M Loss on BTC and ETH Short Positions
Gate News message, as the market rises, whale "pension-usdt.eth" is now sitting on a floating loss of over $11.7M on its $BTC and $ETH 3x short positions.
GateNews1h ago
