
Key Takeaways
-
Ethereum (ETH) is consolidating near the $3,300–$3,315 range after gaining nearly 7% this week.
-
The daily chart shows a well-defined ascending triangle, a bullish continuation pattern.
-
A confirmed breakout above $3,402 could open the door for a move toward the $4,184 target
As of January 18, 2026, Ethereum (ETH) is trading steadily in the $3,300–$3,315 range, showing impressive resilience as the broader crypto market continues to build momentum into the new year. ETH has already climbed nearly 7% this week, signaling renewed buyer interest after months of consolidation.
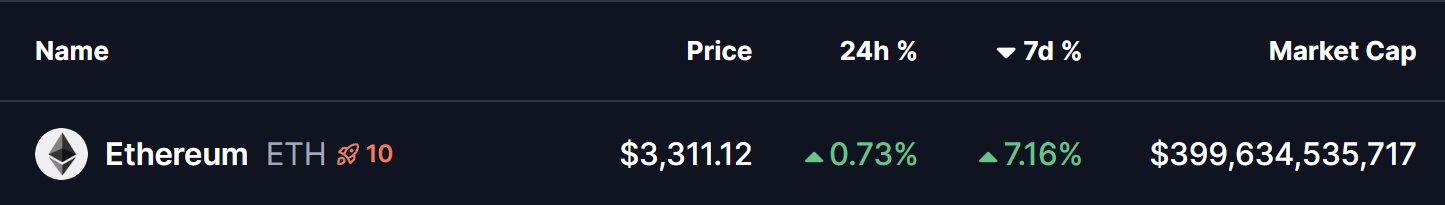
Source: Coinmarketcap
More importantly, Ethereum’s chart structure is flashing a technically compelling setup that has traders watching closely. With pressure building just below a major resistance zone, the big question now is whether bulls can finally push ETH above the psychologically important $4,000 level in the coming week.
Ascending Triangle In Play
On the daily chart, Ethereum is forming a classic ascending triangle pattern that has been developing since late 2025. This bullish continuation structure is defined by a series of higher lows pressing upward against a well-established horizontal resistance zone near $3,400.
Price action shows ETH consistently respecting the rising support trendline, with buyers stepping in on every dip. Most recently, ETH bounced cleanly from this ascending support and has once again pushed back toward the upper boundary of the triangle around the $3,402 region.
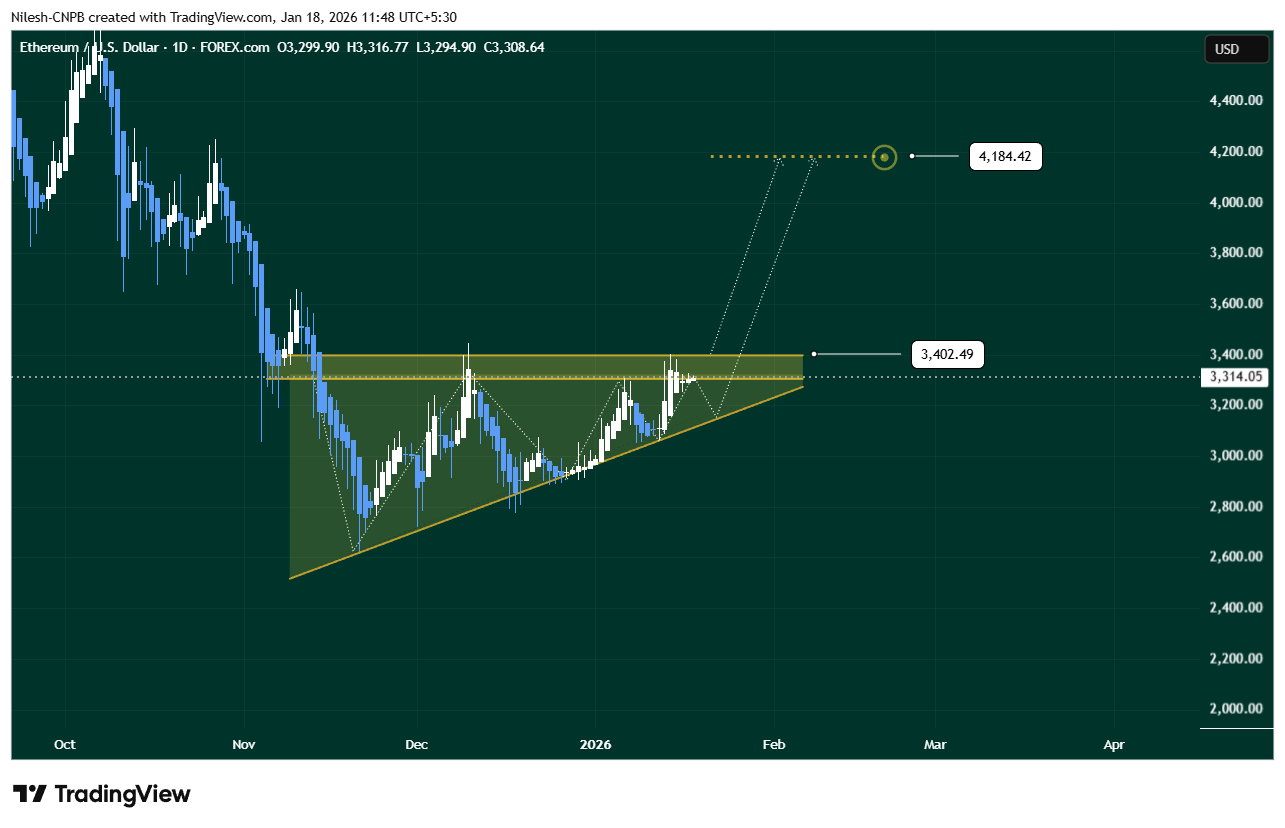
Ethereum (ETH) Daily Chart/Coinsprobe (Source: Tradingview)
This repeated defense of higher lows suggests growing confidence among market participants. Rather than selling into strength, buyers appear willing to accumulate on pullbacks, gradually tightening the range and increasing the odds of a decisive breakout.
Ethereum (ETH) Price Prediction Next Week
From here, Ethereum looks set for another test of the $3,402 resistance zone. A clean daily close above this level would be a major technical signal, potentially confirming the ascending triangle breakout.
On the flip side, if ETH faces rejection at resistance, a short-term dip toward the rising support trendline near $3,158 remains possible. Such a pullback would still keep the bullish structure intact, provided the higher-low formation continues to hold.
In both scenarios, the key level remains the $3,402 neckline. A decisive breakout above this zone, followed by sustained acceptance and a successful retest as support, would validate the pattern and likely trigger a stronger bullish expansion. Based on the triangle’s measured move, the upside target sits near $4,184 — representing roughly a 23% gain from current price levels.
Fundamentals Reinforce the Bullish Case
The technical picture is further supported by improving on-chain fundamentals. Ethereum recently recorded its highest-ever daily transaction count, surpassing 2.59 million transactions on January 15. This surge in network activity reflects growing usage and demand, reinforcing the bullish narrative behind the current price structure.
Bottom Line
Ethereum is approaching a pivotal moment. The ascending triangle pattern is tightening, momentum is building, and on-chain data continues to lean positive. While short-term volatility remains a given in crypto markets, the technical and fundamental setup suggests bulls are positioning for a meaningful move.
If ETH can break and hold above the $3,402 resistance, a push toward $4,000 and beyond could come faster than many expect. All eyes are now on the charts — next week may prove decisive for Ethereum’s next major leg higher.
FAQ
Is Ethereum forming a bullish pattern?
Yes. Ethereum is forming an ascending triangle on the daily timeframe, which is typically considered a bullish continuation pattern.
What is the key resistance level for ETH right now?
The major resistance zone lies around $3,402. A daily close above this level would confirm a bullish breakout.
What is the upside target if ETH breaks out?
Based on the measured move of the ascending triangle, the upside target is near $4,184.
What happens if Ethereum fails to break resistance?
If ETH is rejected at resistance, it could retest its rising support trendline near $3,158 while maintaining the broader bullish structure.
Are fundamentals supporting Ethereum’s price action?
Yes. Ethereum recently recorded its highest-ever daily transaction count, indicating strong network usage and positive on-chain momentum.
Disclaimer: The views and analysis presented in this article are for informational purposes only and reflect the author’s perspective, not financial advice. Technical patterns and indicators discussed are subject to market volatility and may or may not yield the anticipated results. Investors are advised to exercise caution, conduct independent research, and make decisions aligned with their individual risk tolerance.
About Author: Nilesh Hembade is the Founder and Lead Author of Coinsprobe, with over 5 years of experience in the cryptocurrency and blockchain industry. Since launching Coinsprobe in 2023, he has been providing daily, research-driven insights through in-depth market analysis, on-chain data, and technical research.
Disclaimer: The information on this page may come from third parties and does not represent the views or opinions of Gate. The content displayed on this page is for reference only and does not constitute any financial, investment, or legal advice. Gate does not guarantee the accuracy or completeness of the information and shall not be liable for any losses arising from the use of this information. Virtual asset investments carry high risks and are subject to significant price volatility. You may lose all of your invested principal. Please fully understand the relevant risks and make prudent decisions based on your own financial situation and risk tolerance. For details, please refer to
Disclaimer.
Related Articles
ETH rises 0.65% in 15 minutes: spot buying led to net capital inflows
Between 2026-04-16 15:00 and 15:15 (UTC), the ETH price recorded a +0.65% return. The highest price in the range was 2330.16 USDT, while the lowest was 2308.58 USDT, with a swing of 0.93%. The short-term rally immediately drew market attention, increasing capital activity; volatility remained moderately elevated, characterized by strengthening spot buying power.
The main driving force behind this unusual move is that buy orders in the spot markets of major trading platforms continued to dominate. Within 15 minutes, the buy volume accounted for 58%–59%, and the total buy volume was about 2.2K–2.6K ETH
GateNews2h ago
Bitcoin, Ethereum and Solana ETFs Record Positive Net Inflows on April 16
Gate News message, according to the April 16 update, Bitcoin ETFs recorded a 1-day net inflow of +2,855 BTC (+$209.95M) and a 7-day net inflow of +11,849 BTC (+$871.52M). Ethereum ETFs showed a 1-day net inflow of +15,477 ETH (+$35.44M) and a 7-day net inflow of +90,366 ETH (+$206.94M). Solana ETFs
GateNews3h ago
Ethereum Foundation Announces ETH Rangers Project Results: Over $5.8M in Recovered or Frozen Assets
The Ethereum Foundation's ETH Rangers project has successfully completed, funding 17 researchers to enhance public security in the ecosystem. Achievements include recovering $5.8M in assets, identifying over 785 vulnerabilities, and developing several security tools.
GateNews3h ago
ETH drops 1.23% in 15 minutes: Retail’s concentrated sell-off and amplified ETF fund outflows weigh on the spot order book
2026-04-16 13:45 to 14:00 (UTC), ETH spot prices fell by 1.23% in just 15 minutes. The candlestick price range covered 2291.2 to 2336.98 USDT, with a swing of 1.96%. Market volatility intensified, sell pressure on the board became concentrated, and the trading community’s focus clearly shifted toward changes in capital outflows.
The main driver behind this abnormal move is large-scale, concentrated selling from retail. In the spot market, net outflows in the first 5 minutes reached as high as -$95.57M. Although some lead/major funds attempted to accumulate at lower prices (net inflows of +$18.95M in large orders over 5 minutes), the overall scale was limited and unable to effectively hedge the overall short-term selling pressure. Meanwhile, the ETH futures market did not show extreme liquidations or large-scale position closures, indicating that the core of the abnormal move came from a spot supply-and-demand imbalance rather than leveraged liquidation cascades.
In addition, ETH spot ETF funds have continued to experience net outflows in early April. On April 1, the single-day net outflow was $7.1M. The overall trend in Q1 was bearish, directly reflecting weakening institutional capital allocation intent and further undermining market confidence. Some funds have shifted to on-chain staking and emerging DeFi protocols. It is also worth noting that large holders with holdings in the 100,000-ETH range have continued to reduce their positions since the end of March. Whale capital outflows have persisted, and retail has followed the above signals, leading to a multi-factor selloff resonance effect in the short term. Although both the number of active addresses on the ETH chain and daily trading volume have hit historical highs, network usage and liquidity are overall strong, but capital flow has not formed any substantive spot buy orders, making it difficult to drive a price reversal.
At present, short-term market risk remains significant. Investors should pay attention to the strength of subsequent retail selling, the direction of ETF fund flows, and changes in large-holder positions. If large holders and major funds do not form a strong follow-through/acceptance, the spot market may continue to be affected by the release of structural supply. It is recommended that investors monitor key support zones in real time, track large on-chain fund movements, and watch for macro news developments, in order to reasonably mitigate the risk of short-term price fluctuations and promptly obtain more market information.
GateNews3h ago
ETH falls below 2300 USDT
Gate News bot message, Gate quotes show that ETH has fallen below 2300 USDT, with the current price at 2296.29 USDT.
CryptoRadar4h ago
Charles Schwab Launches Schwab Crypto Spot Trading for Bitcoin and Ethereum
Charles Schwab launched Schwab Crypto on April 16, a spot cryptocurrency trading service for retail customers. It supports direct trading of Bitcoin and Ethereum and offers education and support, integrating with existing financial services.
GateNews4h ago
