
Key Takeaways
-
Ethereum (ETH) is trading near $3,160 after a broader market pullback driven by macro uncertainty.
-
The ascending triangle pattern on the daily chart remains intact, signaling a bullish structure.
-
Price is approaching a critical ascending trendline support around $3,130–$3,150.
-
Historically, buyers have defended this zone, increasing the chances of a short-term rebound.
-
A confirmed breakdown below trendline support could weaken the bullish outlook in the near term.
As of January 20, 2026, Ethereum (ETH) is trading in the red near $3,164, down 1.33% from its Sunday high of around $3,367. The pullback comes amid a broader market downturn sparked by escalating US–EU trade tensions, which have pushed Bitcoin (BTC) below $92,000 and dragged major altcoins, including ETH, lower.
While short-term sentiment has clearly taken a hit, Ethereum’s overall technical structure remains constructive, suggesting this move may be more of a controlled pullback than the start of a deeper breakdown.
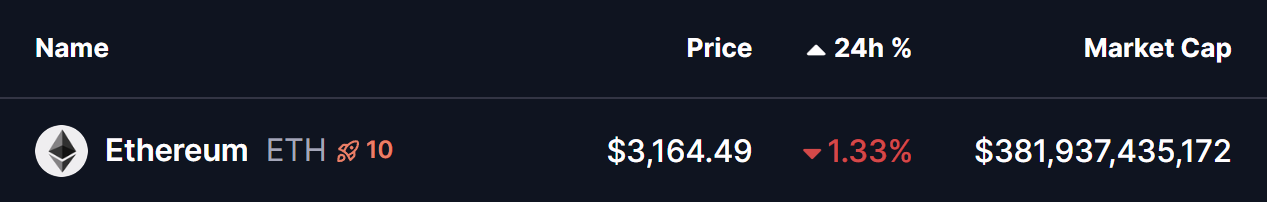
Source: Coinmarketcap
Ascending Triangle Still Intact on the Daily Chart
Looking at the daily chart, Ethereum continues to trade within a well-defined ascending triangle pattern that has been developing since late 2025. This structure is marked by a sequence of higher lows, supported by a rising trendline, pressing against a strong horizontal resistance zone near $3,400.
During the latest upswing, ETH once again tested this resistance area but failed to break through convincingly. The rejection triggered the current pullback, with price now gradually drifting lower toward the ascending trendline support, which has consistently acted as a demand zone over the past few months.
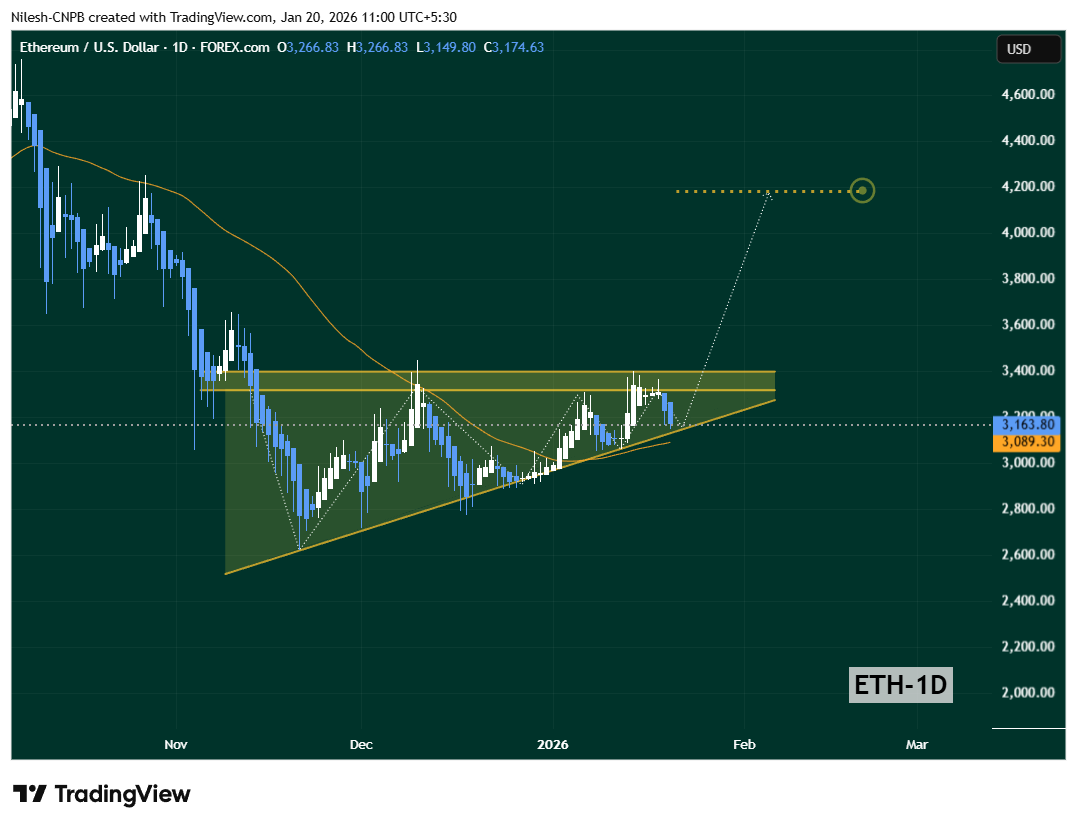
Ethereum (ETH) Daily Chart/Coinsprobe (Source: Tradingview)
This price behavior suggests the current dip is part of a broader consolidation within the triangle, rather than a bearish trend reversal.
Key Support Zone Under the Spotlight
As ETH trades around $3,160, attention is shifting toward the $3,130–$3,150 zone, where the ascending trendline converges with previous reaction points on the chart.
If Ethereum dips slightly further into this region and buyers step in with conviction, it would strengthen the bullish case and keep the ascending triangle firmly in play. Historically, this support has attracted aggressive buying, often leading to sharp rebounds back toward the upper resistance band.
A solid bounce from this area could set the stage for another attempt at the $3,400 resistance, especially if broader market conditions stabilize and Bitcoin finds its footing.
What Could Invalidate the Bullish Setup?
While the structure remains bullish for now, the risk is clear. A decisive daily close below the rising trendline would weaken the ascending triangle thesis and open the door for deeper downside in the short term.
Such a breakdown would suggest that buyers are losing control, potentially exposing ETH to a move toward lower support zones as traders reassess risk amid ongoing macro uncertainty.
Bottom Line
Ethereum is currently sitting at a make-or-break technical level. Despite macro-driven volatility and risk-off sentiment across global markets, ETH’s chart still favors a potential rebound as long as the ascending trendline support continues to hold.
For now, this looks like a healthy pullback within a larger consolidation, not a structural breakdown. The next reaction near trendline support will be critical. If bulls defend it once again, Ethereum could be setting up for another push toward the top of the triangle.
Disclaimer: The views and analysis presented in this article are for informational purposes only and reflect the author’s perspective, not financial advice. Technical patterns and indicators discussed are subject to market volatility and may or may not yield the anticipated results. Investors are advised to exercise caution, conduct independent research, and make decisions aligned with their individual risk tolerance.
About Author: Nilesh Hembade is the Founder and Lead Author of Coinsprobe, with over 5 years of experience in the cryptocurrency and blockchain industry. Since launching Coinsprobe in 2023, he has been providing daily, research-driven insights through in-depth market analysis, on-chain data, and technical research.
Disclaimer: The information on this page may come from third parties and does not represent the views or opinions of Gate. The content displayed on this page is for reference only and does not constitute any financial, investment, or legal advice. Gate does not guarantee the accuracy or completeness of the information and shall not be liable for any losses arising from the use of this information. Virtual asset investments carry high risks and are subject to significant price volatility. You may lose all of your invested principal. Please fully understand the relevant risks and make prudent decisions based on your own financial situation and risk tolerance. For details, please refer to
Disclaimer.
Related Articles
ETH rises 0.65% in 15 minutes: spot buying led to net capital inflows
Between 2026-04-16 15:00 and 15:15 (UTC), the ETH price recorded a +0.65% return. The highest price in the range was 2330.16 USDT, while the lowest was 2308.58 USDT, with a swing of 0.93%. The short-term rally immediately drew market attention, increasing capital activity; volatility remained moderately elevated, characterized by strengthening spot buying power.
The main driving force behind this unusual move is that buy orders in the spot markets of major trading platforms continued to dominate. Within 15 minutes, the buy volume accounted for 58%–59%, and the total buy volume was about 2.2K–2.6K ETH
GateNews2h ago
Bitcoin, Ethereum and Solana ETFs Record Positive Net Inflows on April 16
Gate News message, according to the April 16 update, Bitcoin ETFs recorded a 1-day net inflow of +2,855 BTC (+$209.95M) and a 7-day net inflow of +11,849 BTC (+$871.52M). Ethereum ETFs showed a 1-day net inflow of +15,477 ETH (+$35.44M) and a 7-day net inflow of +90,366 ETH (+$206.94M). Solana ETFs
GateNews3h ago
Ethereum Foundation Announces ETH Rangers Project Results: Over $5.8M in Recovered or Frozen Assets
The Ethereum Foundation's ETH Rangers project has successfully completed, funding 17 researchers to enhance public security in the ecosystem. Achievements include recovering $5.8M in assets, identifying over 785 vulnerabilities, and developing several security tools.
GateNews3h ago
ETH drops 1.23% in 15 minutes: Retail’s concentrated sell-off and amplified ETF fund outflows weigh on the spot order book
2026-04-16 13:45 to 14:00 (UTC), ETH spot prices fell by 1.23% in just 15 minutes. The candlestick price range covered 2291.2 to 2336.98 USDT, with a swing of 1.96%. Market volatility intensified, sell pressure on the board became concentrated, and the trading community’s focus clearly shifted toward changes in capital outflows.
The main driver behind this abnormal move is large-scale, concentrated selling from retail. In the spot market, net outflows in the first 5 minutes reached as high as -$95.57M. Although some lead/major funds attempted to accumulate at lower prices (net inflows of +$18.95M in large orders over 5 minutes), the overall scale was limited and unable to effectively hedge the overall short-term selling pressure. Meanwhile, the ETH futures market did not show extreme liquidations or large-scale position closures, indicating that the core of the abnormal move came from a spot supply-and-demand imbalance rather than leveraged liquidation cascades.
In addition, ETH spot ETF funds have continued to experience net outflows in early April. On April 1, the single-day net outflow was $7.1M. The overall trend in Q1 was bearish, directly reflecting weakening institutional capital allocation intent and further undermining market confidence. Some funds have shifted to on-chain staking and emerging DeFi protocols. It is also worth noting that large holders with holdings in the 100,000-ETH range have continued to reduce their positions since the end of March. Whale capital outflows have persisted, and retail has followed the above signals, leading to a multi-factor selloff resonance effect in the short term. Although both the number of active addresses on the ETH chain and daily trading volume have hit historical highs, network usage and liquidity are overall strong, but capital flow has not formed any substantive spot buy orders, making it difficult to drive a price reversal.
At present, short-term market risk remains significant. Investors should pay attention to the strength of subsequent retail selling, the direction of ETF fund flows, and changes in large-holder positions. If large holders and major funds do not form a strong follow-through/acceptance, the spot market may continue to be affected by the release of structural supply. It is recommended that investors monitor key support zones in real time, track large on-chain fund movements, and watch for macro news developments, in order to reasonably mitigate the risk of short-term price fluctuations and promptly obtain more market information.
GateNews3h ago
ETH falls below 2300 USDT
Gate News bot message, Gate quotes show that ETH has fallen below 2300 USDT, with the current price at 2296.29 USDT.
CryptoRadar4h ago
Charles Schwab Launches Schwab Crypto Spot Trading for Bitcoin and Ethereum
Charles Schwab launched Schwab Crypto on April 16, a spot cryptocurrency trading service for retail customers. It supports direct trading of Bitcoin and Ethereum and offers education and support, integrating with existing financial services.
GateNews4h ago
