Trade
Basic
Futures
Futures
Hundreds of contracts settled in USDT or BTC
TradFi
Gold
Trade global traditional assets with USDT in one place
Options
Hot
Trade European-style vanilla options
Unified Account
Maximize your capital efficiency
Demo Trading
Futures Kickoff
Get prepared for your futures trading
Futures Events
Participate in events to win generous rewards
Demo Trading
Use virtual funds to experience risk-free trading
Earn
Launch
CandyDrop
Collect candies to earn airdrops
Launchpool
Quick staking, earn potential new tokens
HODLer Airdrop
Hold GT and get massive airdrops for free
Launchpad
Be early to the next big token project
Alpha Points
Trade on-chain assets and enjoy airdrop rewards!
Futures Points
Earn futures points and claim airdrop rewards
Investment
Simple Earn
Earn interests with idle tokens
Auto-Invest
Auto-invest on a regular basis
Dual Investment
Buy low and sell high to take profits from price fluctuations
Soft Staking
Earn rewards with flexible staking
Crypto Loan
0 Fees
Pledge one crypto to borrow another
Lending Center
One-stop lending hub
VIP Wealth Hub
Customized wealth management empowers your assets growth
Private Wealth Management
Customized asset management to grow your digital assets
Quant Fund
Top asset management team helps you profit without hassle
Staking
Stake cryptos to earn in PoS products
Smart Leverage
New
No forced liquidation before maturity, worry-free leveraged gains
GUSD Minting
Use USDT/USDC to mint GUSD for treasury-level yields
More
CDOG
Gate FunGo to Trade
CryptoDog, the cute and fun dog image that connects to the Web3 ecosystem, is anchored in decentralized consensus and community co-creation. It aims to create a secure, lightweight value circulation token. Combining entertaining IP with digital finance, it allows every participant to share digital dividends as the ecosystem grows.
MC:$2.38KHolders:1
0.00%
SongJinanA
 0
0
3.2 Double Bottom Analysis
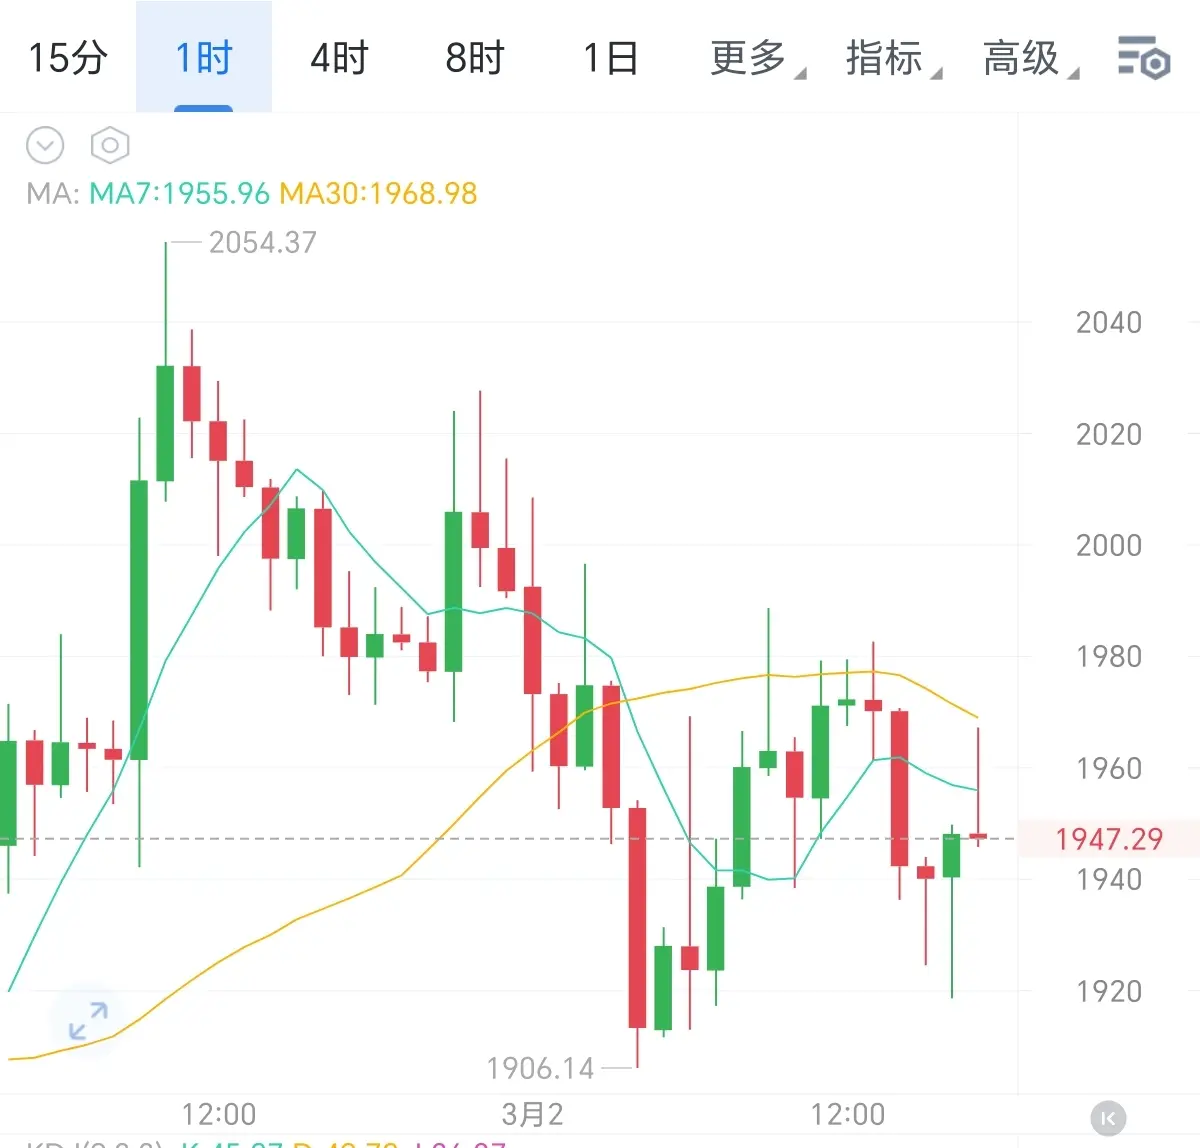
The double bottom formed in 1947, located below the MA7 and MA30, with moving averages in a bearish alignment, indicating a short-term weak trend. Recently, the high point was 2054 and the low point was 1906. Currently, it is near the lower boundary of the range, with support levels at 1920-1906. Resistance levels are first at 1968, then at 1985-2000. The 1-hour candlestick chart shows repeated fluctuations between bulls and bears, with insufficient rebound strength. If it breaks below 1906, it may further decline to test the strong support at 1840. Middle Eastern ge
The double bottom formed in 1947, located below the MA7 and MA30, with moving averages in a bearish alignment, indicating a short-term weak trend. Recently, the high point was 2054 and the low point was 1906. Currently, it is near the lower boundary of the range, with support levels at 1920-1906. Resistance levels are first at 1968, then at 1985-2000. The 1-hour candlestick chart shows repeated fluctuations between bulls and bears, with insufficient rebound strength. If it breaks below 1906, it may further decline to test the strong support at 1840. Middle Eastern ge
BTC-0,48%
- Reward
- 2
- Comment
- Repost
- Share
Join 40M users in our growing community
⚡️ Join 40M users in the crypto craze discussion
💬 Engage with your favorite top creators
👍 See what interests you
Hot Gate Fun
View More- MC:$2.38KHolders:10.00%
- MC:$0.1Holders:10.00%
- MC:$2.38KHolders:10.00%
- MC:$2.38KHolders:10.00%
- MC:$2.38KHolders:10.00%
- MC:$0.1Holders:00.00%
- MC:$0.1Holders:10.00%
- MC:$2.37KHolders:10.00%
- MC:$2.37KHolders:10.00%
- MC:$0.1Holders:10.00%
News
View MoreCurve Finance: Investigation into sDOLA LlamaLend attack initiated; attacker profits are limited
9 m
Iran: Ready for a Prolonged War
17 m
ProCap Financial adds 450 Bitcoin to the purchase holdings
18 m
Foreign media: The traffic volume through the Strait of Hormuz has decreased by approximately 70%
28 m
Turkey's ruling party proposes a 10% tax on crypto income and a 0.03% service provider transaction tax
31 m
Pin