XRP’s price has recorded a recovery move of about 3% from the $1.31 support level set on 27/3, thereby reclaiming the $1.35 mark. However, this development is likely forming a bear flag, rather than signaling the start of a sustained recovery trend—especially as the broader market still lacks momentum to support such a move.
Since reaching the $1.60 high on 17/3, XRP has corrected by roughly 18%. Although the short-term rebound provides a positive chart pattern signal, the technical chart data, derivatives market, and on-chain data all point to a more cautious scenario.
Bear flag takes shape; hidden bearish divergence signals rising risk
On the 12-hour timeframe, XRP is moving within a typical bear flag structure. The “flagpole” is formed by the sharp drop from $1.60 to $1.31, while the current 3% rebound is creating the “flag” portion—a mildly rising channel that often ends with another downward leg with an amplitude roughly equivalent.
If the lower trendline of the pattern is broken, the downside scenario of about 18% could be triggered, pushing the price back to the $1.08 area.
The RSI index continues to reinforce the bearish view. In the period from 6/2 to 28/3 (12-hour timeframe), price has been forming lower highs while the RSI has been setting higher highs—an instance of hidden bearish divergence that usually indicates the current downtrend will continue rather than reverse.
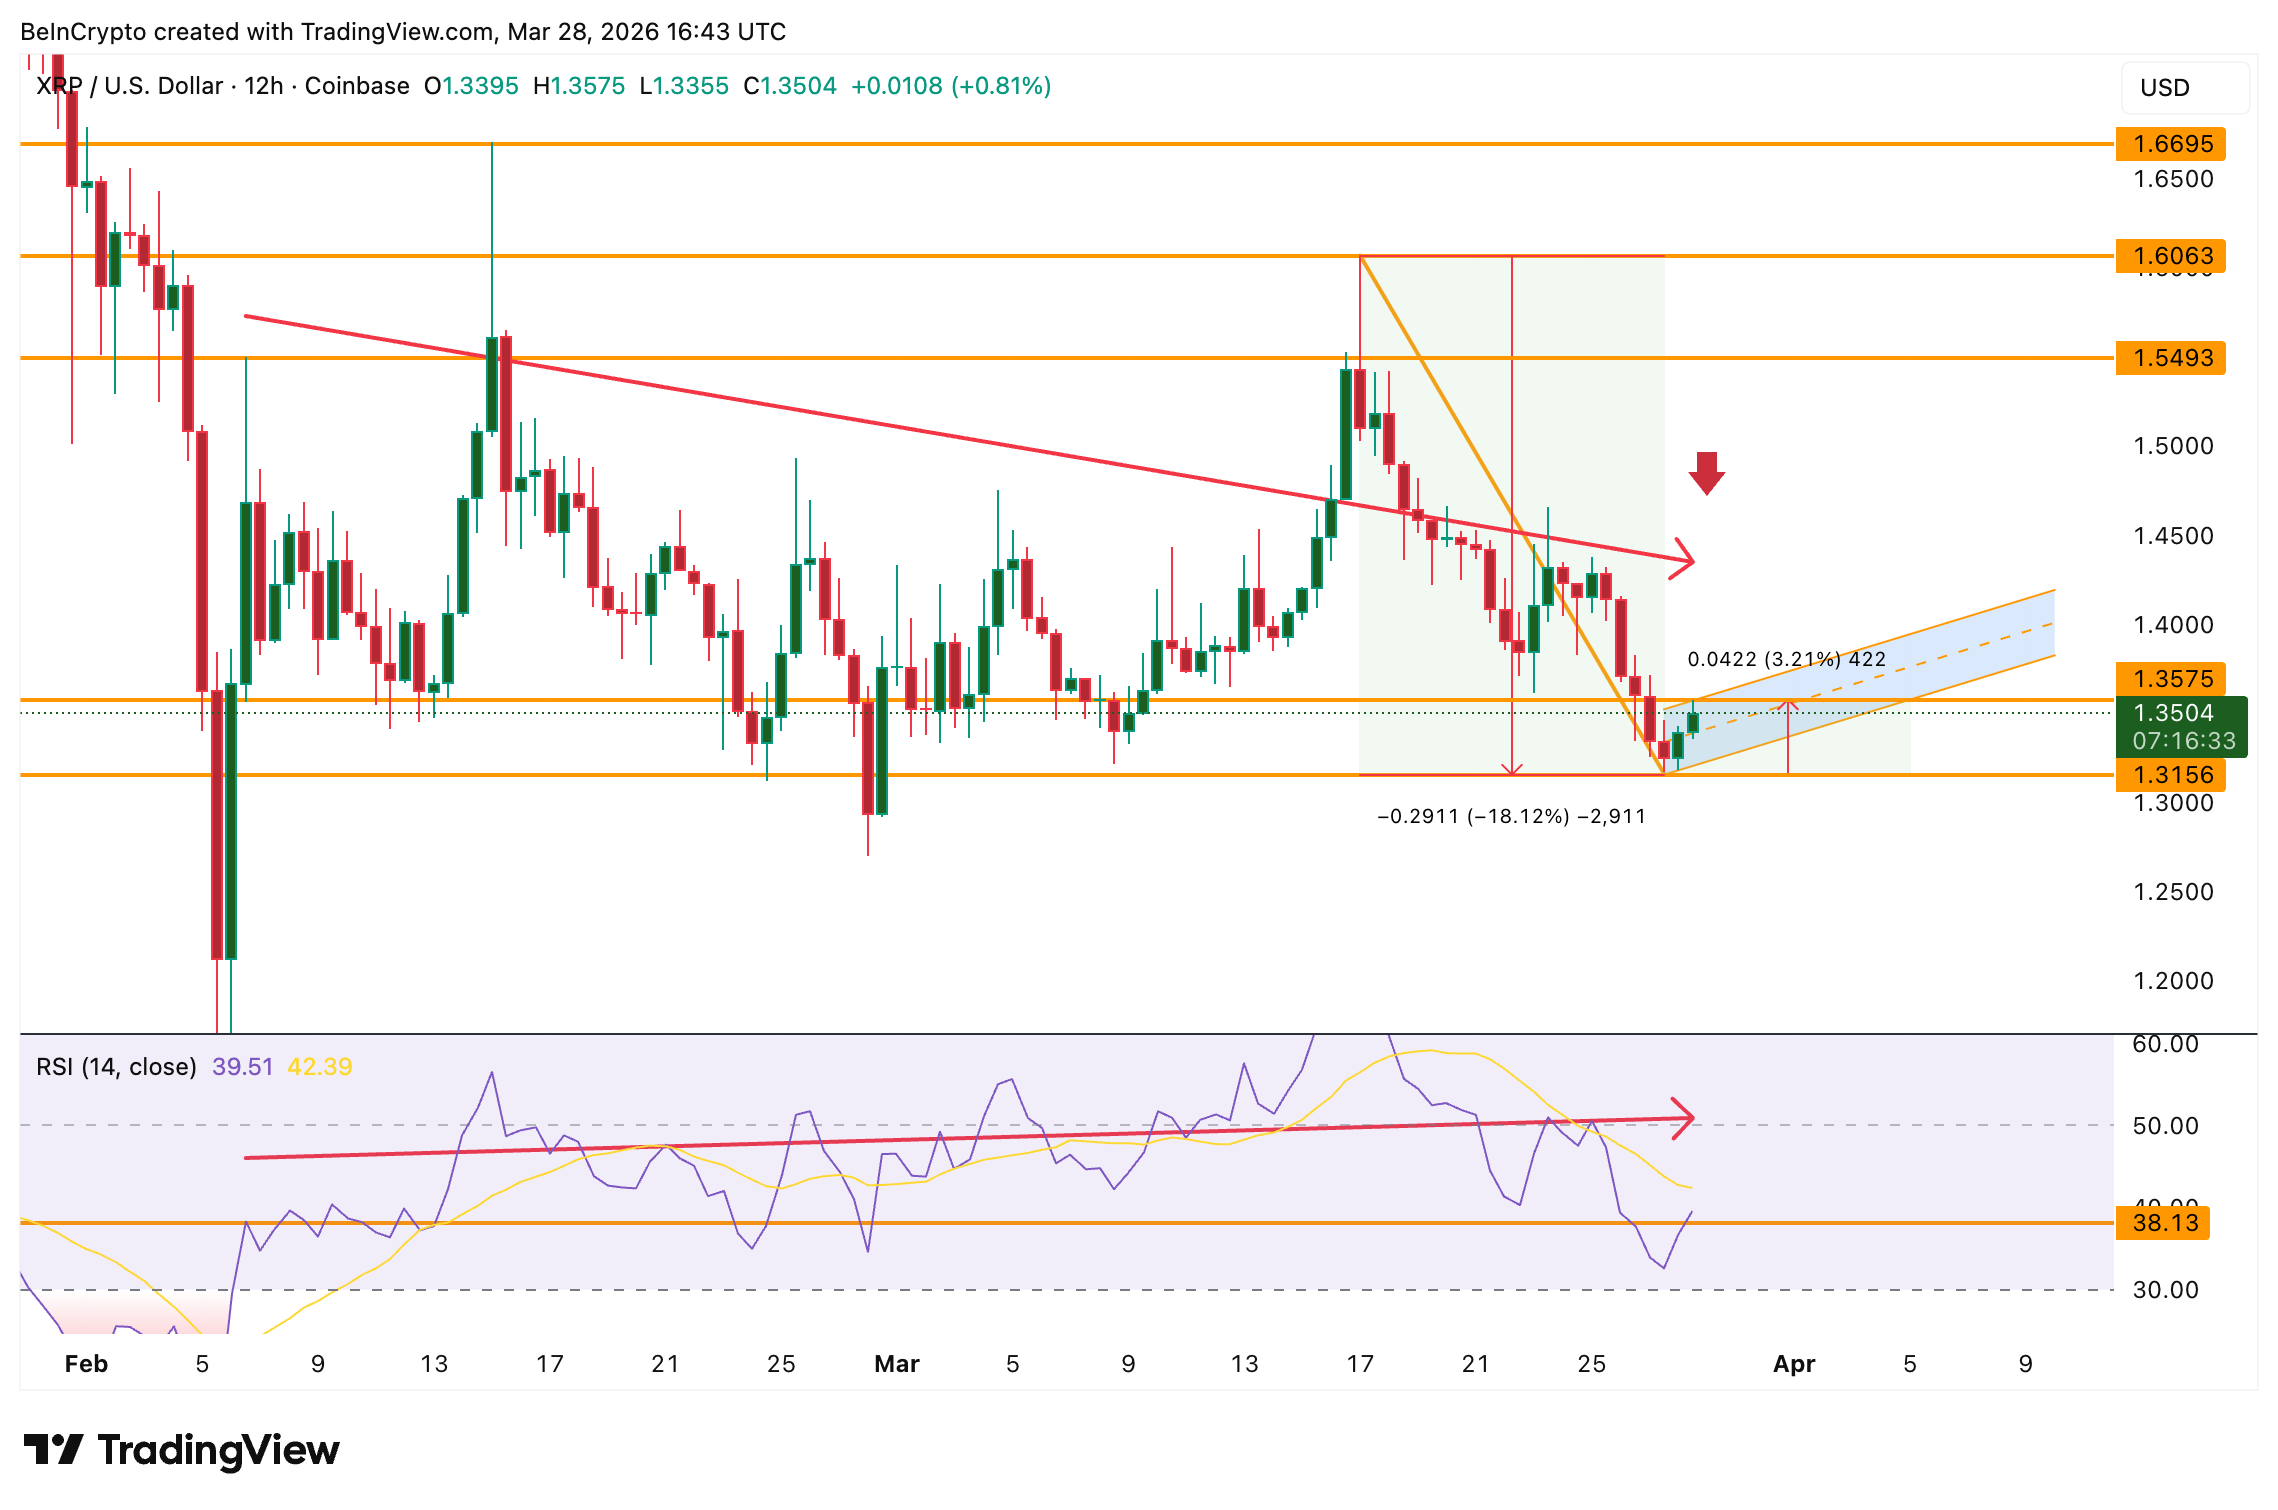 Hidden bearish divergence of the RSI | Source: TradingViewThis signal still needs confirmation, with the condition that the next 12-hour candle closes below $1.35. Conversely, if price breaks above and holds above this level, the bearish structure will be temporarily delayed. The bearish scenario is only completely invalidated if XRP breaks back above $1.60.
Open interest (OI) rises, but long-term capital inflows weaken
Derivatives data shows XRP’s open interest (OI) increased from $737.72 million to $759.21 million (+2.9%) since the price rebounded. At the same time, the funding rate narrowed its negative range from -0.011% to -0.003%, reflecting that long positions are increasing during the rebound.
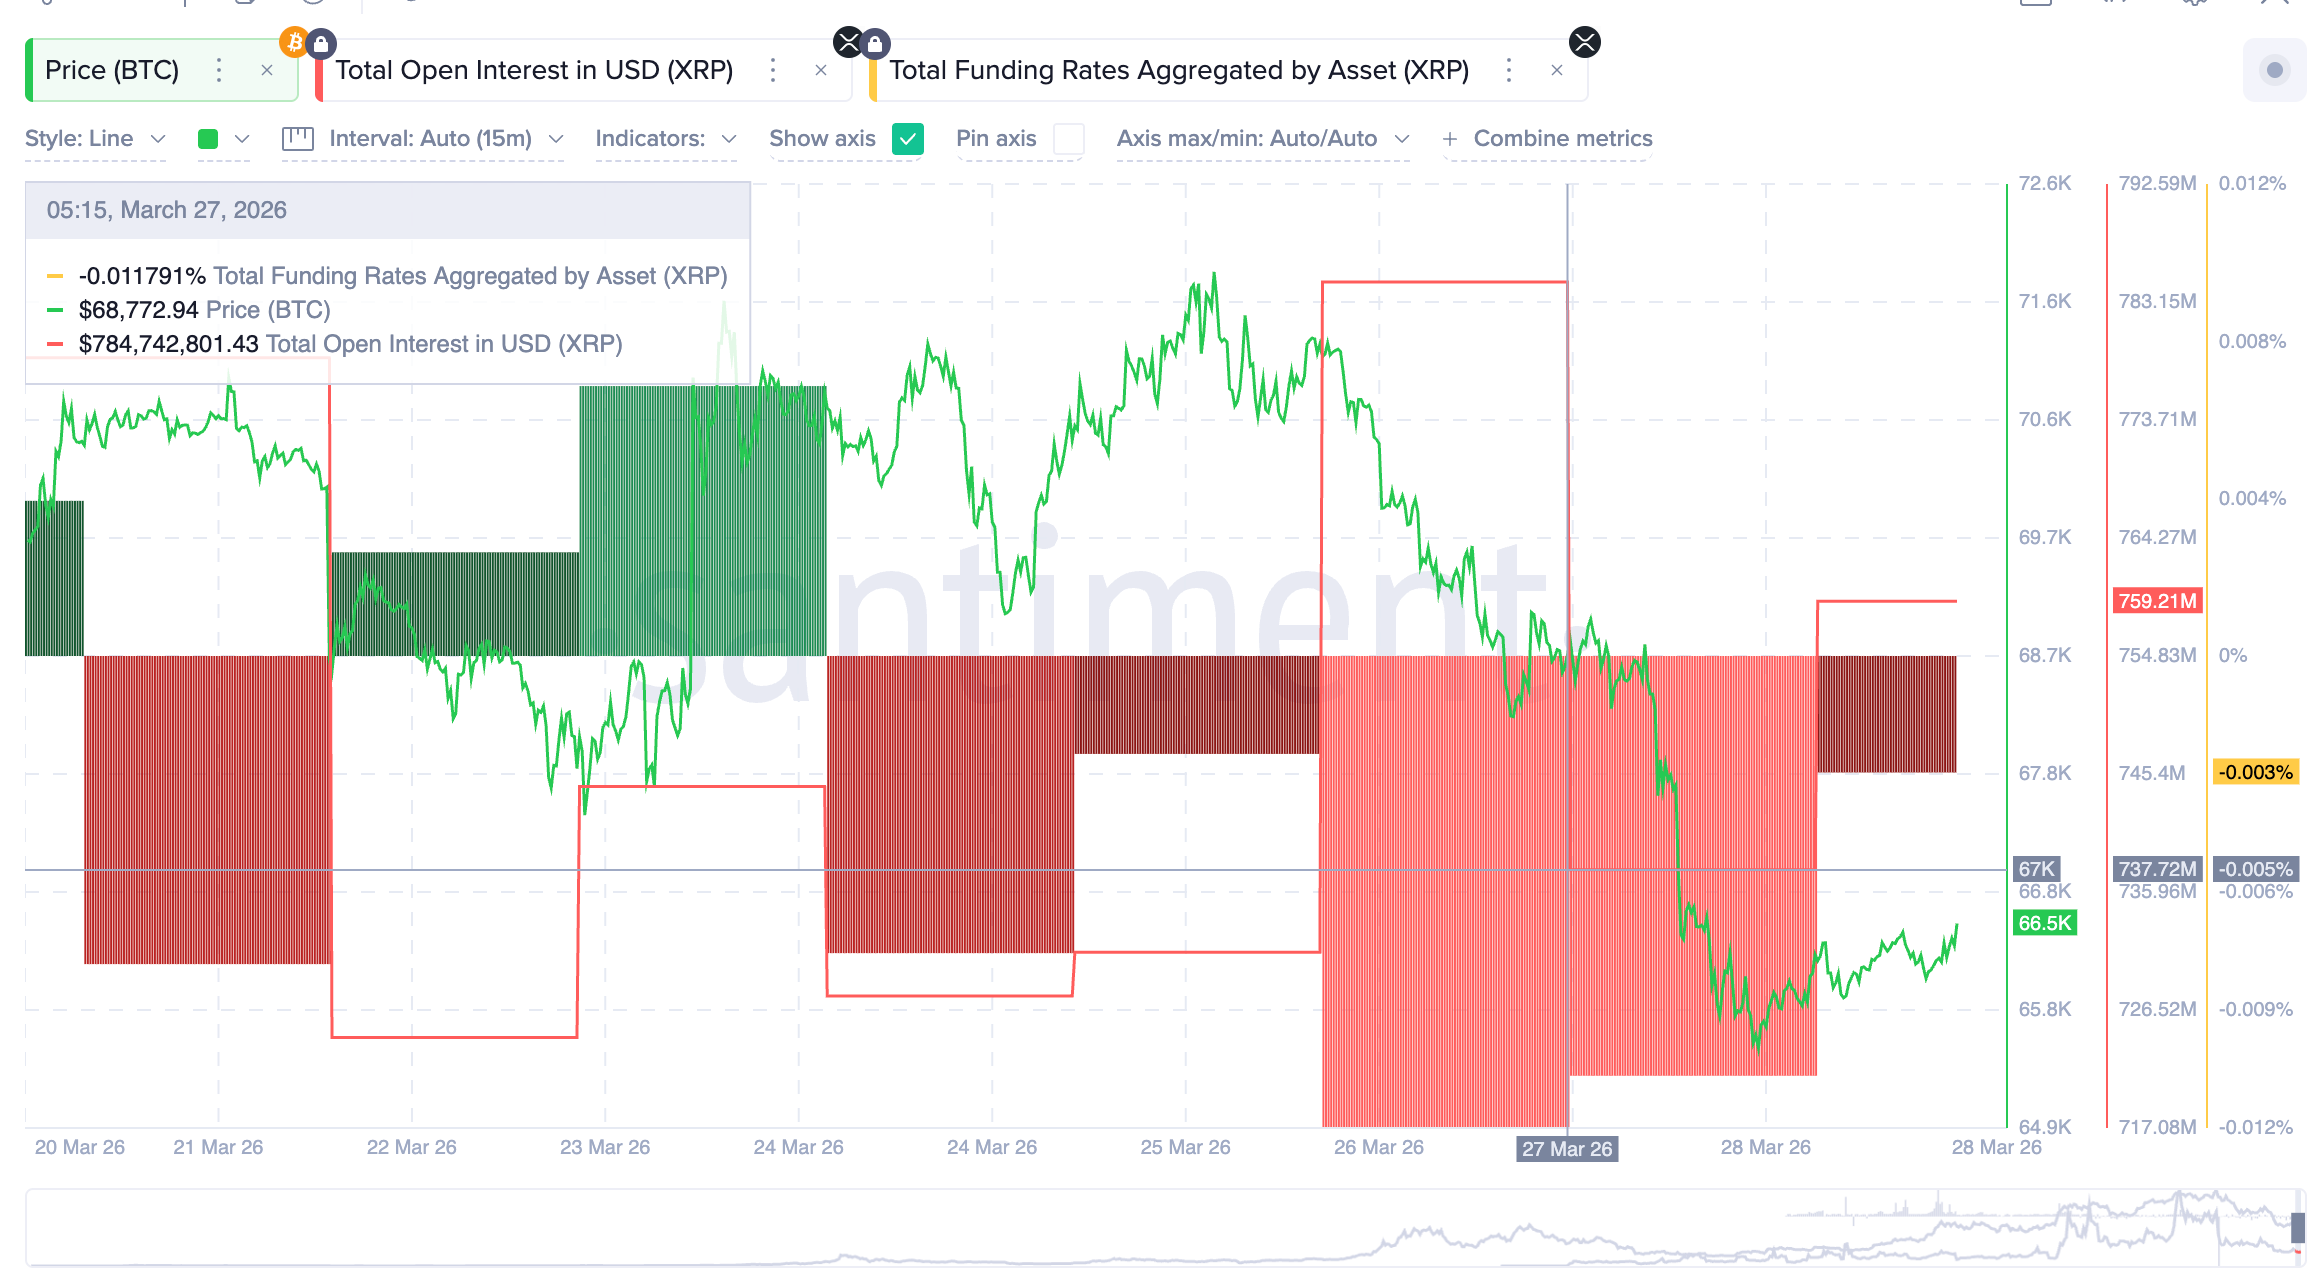 XRP open interest and funding rate | Source: SantimentHowever, OI rising in the context of price rebounding within a bear flag structure is often a warning sign. If the downward reversal trend occurs, leveraged long positions that entered here could become a source of liquidations, amplifying selling pressure.
On the other hand, the spot market does not show supportive strength to match. Data from Glassnode indicates that the holdings of long-term holders (≥155 days) have fallen from about 238 million XRP to 229.78 million XRP since 25/3, equivalent to a decline of 3.47%.
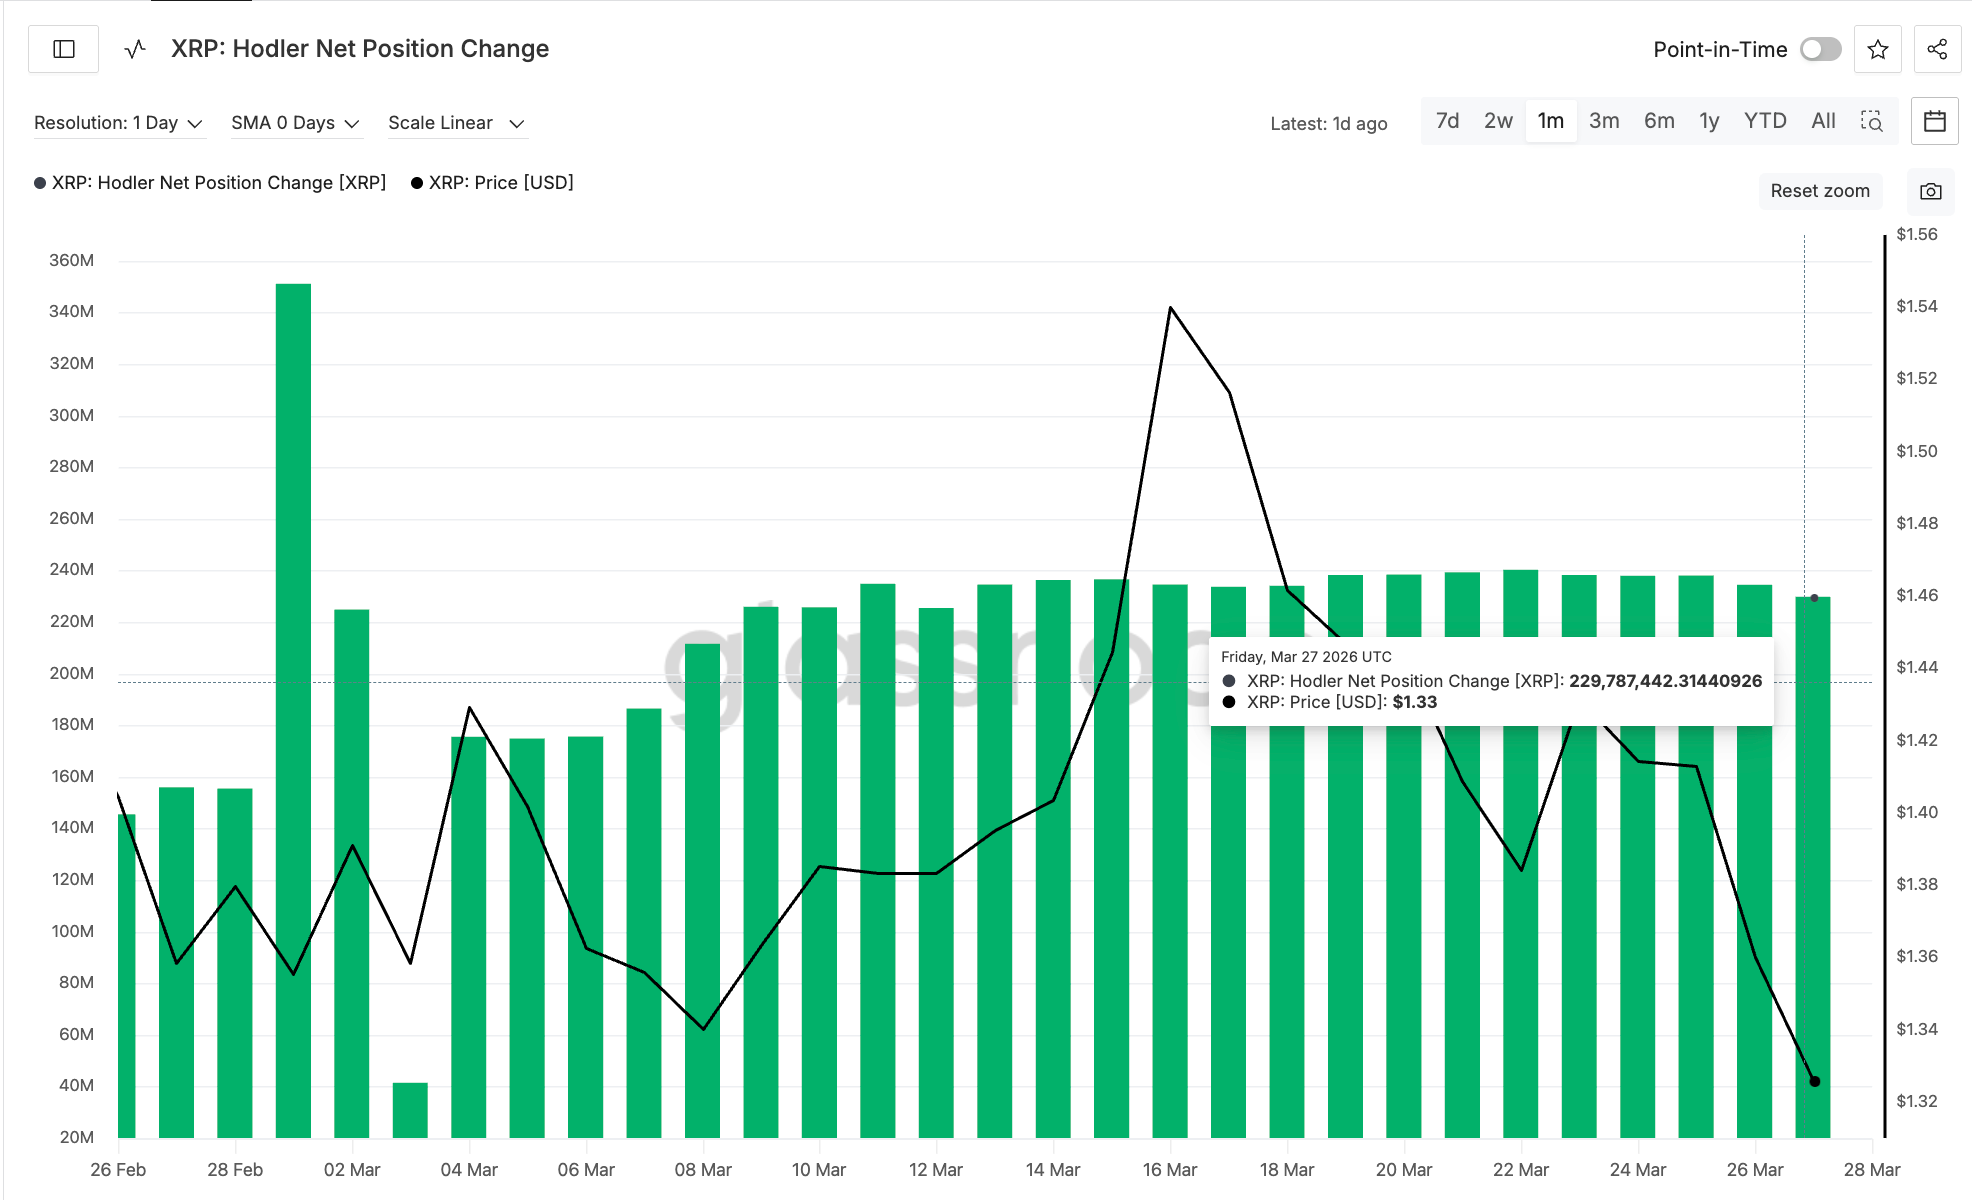 Change in net positions of XRP Hodler | Source: GlassnodeThis move suggests long-term holders are quietly reducing their positions just ahead of the rebound. When derivatives flows tilt toward longs while spot flows weaken, the market balance tends to lean toward the sell side.
Price scenario: the $1.35 level is decisive
In the short term, XRP needs a clear 12-hour closing session above $1.35 to postpone the bearish scenario. If successful, the next resistance zones would be at $1.37 and $1.40.
Conversely, if price remains below $1.35, it will open the process of confirming the downtrend. If the $1.31–$1.32 support zone is broken through, the bearish target from the bear flag pattern—about 18%—would be triggered, moving toward the $1.08 area, equivalent to the lowest level since early February 2026.
On the upside, only if XRP breaks above $1.60 can it fully break the current bearish structure and put an end to the declining-lows sequence—which is the main characteristic of the 2026 trend.
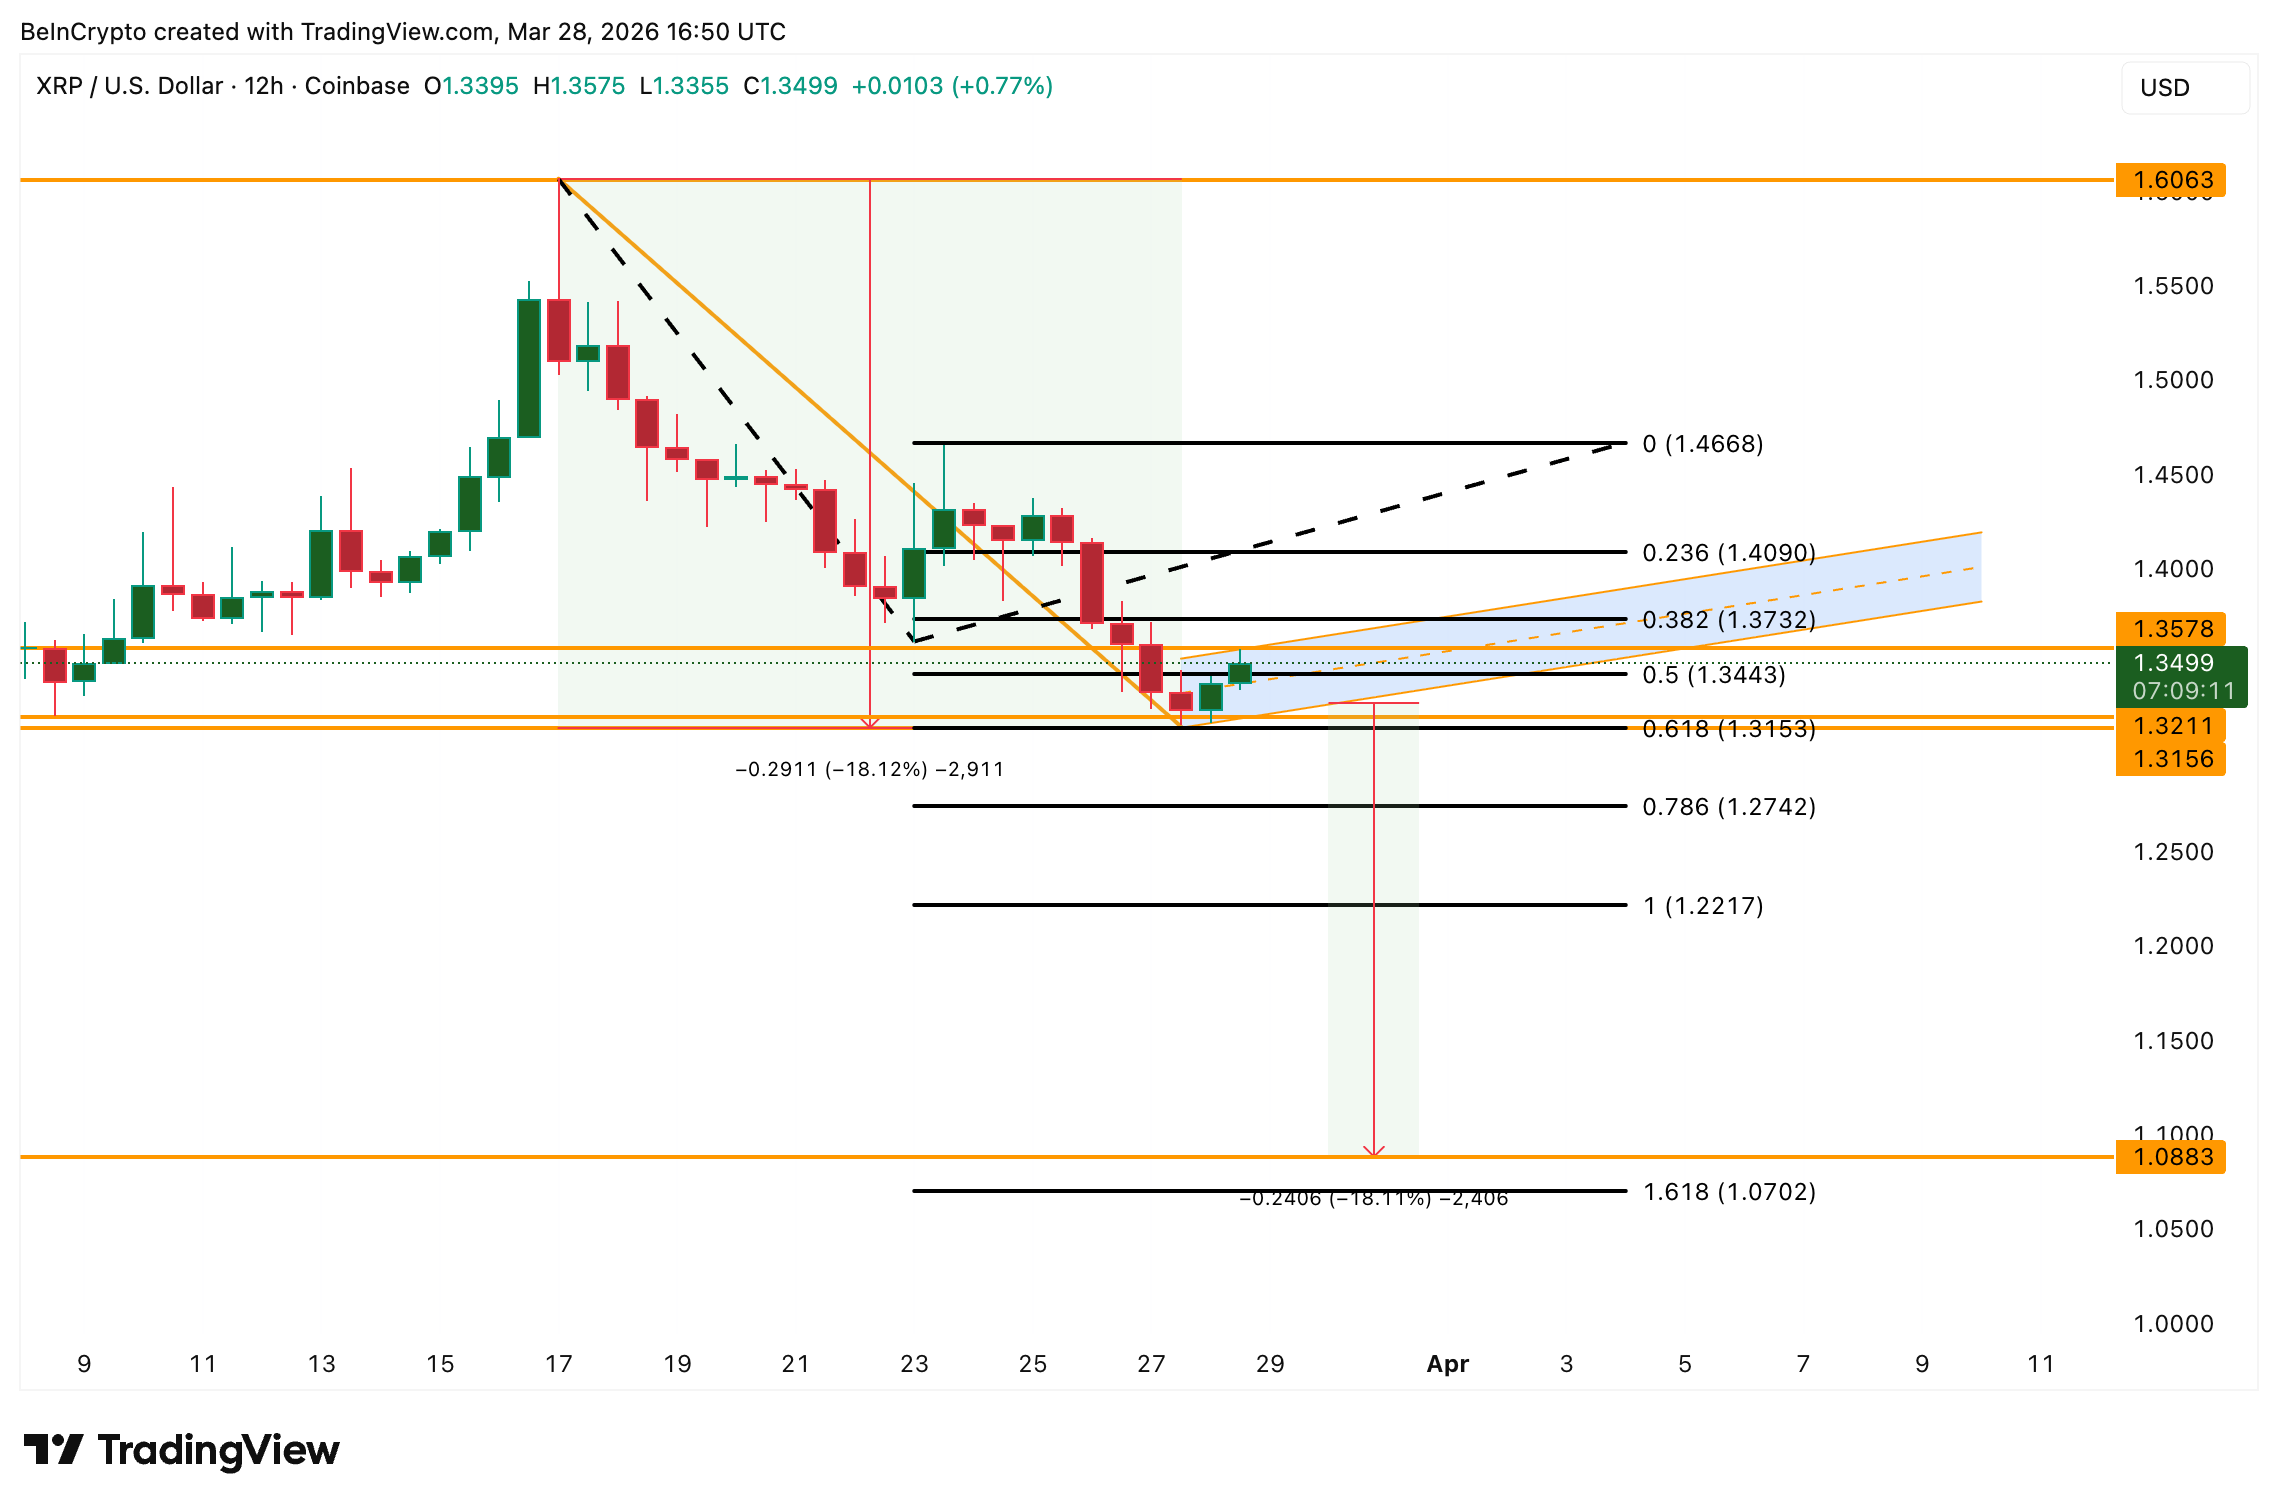 XRP price analysis | Source: TradingViewAt present, the $1.35 level continues to play the role of a crucial dividing line, separating a delayed bearish scenario from the risk of a deeper correction toward the $1.08 region.
Disclaimer: The information on this page may come from third parties and does not represent the views or opinions of Gate. The content displayed on this page is for reference only and does not constitute any financial, investment, or legal advice. Gate does not guarantee the accuracy or completeness of the information and shall not be liable for any losses arising from the use of this information. Virtual asset investments carry high risks and are subject to significant price volatility. You may lose all of your invested principal. Please fully understand the relevant risks and make prudent decisions based on your own financial situation and risk tolerance. For details, please refer to
Disclaimer.
