
Key Takeaways
-
SAND price is showing early signs of stabilization after recent downside pressure.
-
Buyers appear to be defending a key support zone, hinting at a potential short-term rebound.
-
A breakout above nearby resistance could open the door for a stronger recovery move.
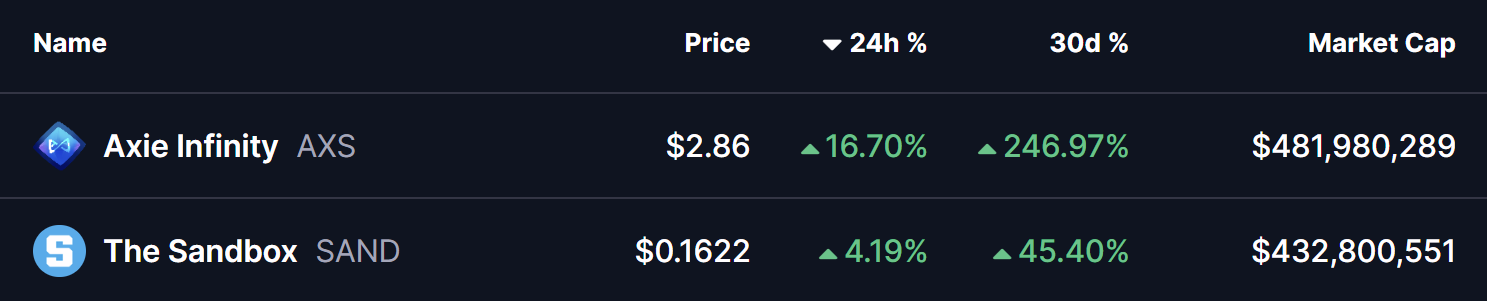
Gaming-focused crypto tokens are back in the spotlight after Axie Infinity (AXS) posted a sharp rally of over 16% in a single day and more than 246% over the past month, reigniting optimism around the gaming narrative. Riding this renewed momentum, Sandbox (SAND) has also stepped into focus, climbing nearly 45% as overall market sentiment turns constructive.
Beyond the recent price bounce, the technical structure on the chart is starting to tell a bigger story, hinting that SAND may be setting up for a bullish continuation move.
Source: Coinmarketcap
Descending Broadening Wedge Pattern in Play
On the daily timeframe, SAND is trading within a descending broadening wedge — a bullish reversal pattern that often develops during corrective phases before a trend shift. This structure reflects increasing volatility, with price gradually compressing while buyers quietly regain control.
During the latest pullback, SAND successfully retested the lower boundary of the wedge near the $0.11 zone, an area that has repeatedly acted as strong demand. Buyers stepped in aggressively at this level, triggering a rebound that pushed price toward $0.1711, placing SAND right near the wedge’s upper resistance trendline.
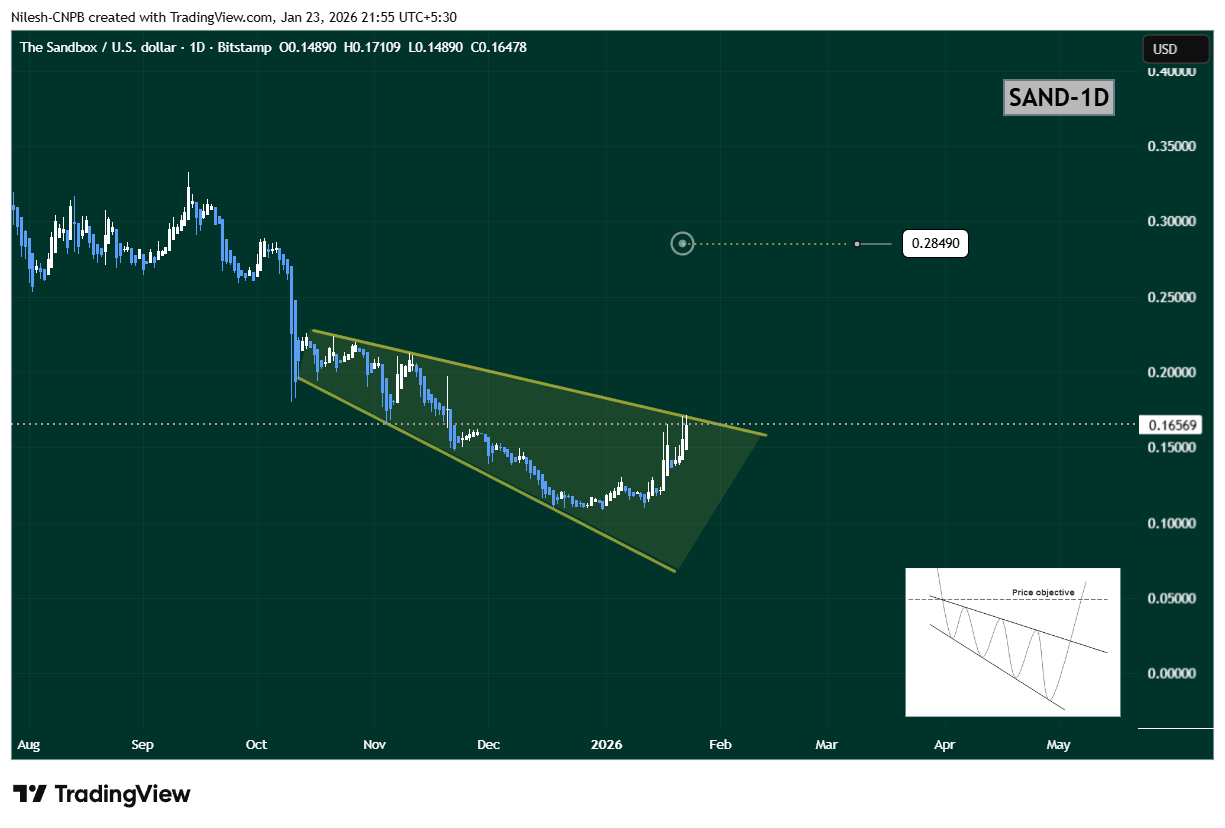
Sandbox (SAND) Daily Chart/Coinsprobe (Source: Tradingview)
The steady rise toward this upper boundary suggests growing bullish momentum and increasing breakout pressure.
What’s Next for SAND?
If buyers manage to push SAND above the upper wedge resistance near $0.1711, it would confirm a bullish breakout from the pattern. In that scenario, the chart opens the door for a move toward the $0.2849 target, which aligns with the measured move of the wedge and represents roughly 73% upside from current levels.
However, if price faces rejection at resistance, SAND could continue consolidating within the wedge structure. In that case, the $0.13–$0.14 region will act as an important short-term support zone to watch.
Bottom Line
SAND’s overall technical structure remains constructive. With a bullish descending broadening wedge in play, buyers defending key support, and gaming tokens gaining renewed attention, Sandbox appears to be positioning for a potential breakout. A confirmed move above resistance could mark the beginning of a stronger upside phase in the sessions ahead.
Disclaimer: The views and analysis presented in this article are for informational purposes only and reflect the author’s perspective, not financial advice. Technical patterns and indicators discussed are subject to market volatility and may or may not yield the anticipated results. Investors are advised to exercise caution, conduct independent research, and make decisions aligned with their individual risk tolerance.
About Author: Nilesh Hembade is the Founder and Lead Author of Coinsprobe, with over 5 years of experience in the cryptocurrency and blockchain industry. Since launching Coinsprobe in 2023, he has been providing daily, research-driven insights through in-depth market analysis, on-chain data, and technical research.
Disclaimer: The information on this page may come from third parties and does not represent the views or opinions of Gate. The content displayed on this page is for reference only and does not constitute any financial, investment, or legal advice. Gate does not guarantee the accuracy or completeness of the information and shall not be liable for any losses arising from the use of this information. Virtual asset investments carry high risks and are subject to significant price volatility. You may lose all of your invested principal. Please fully understand the relevant risks and make prudent decisions based on your own financial situation and risk tolerance. For details, please refer to
Disclaimer.
Related Articles
Polkadot Faces Risk of Sharp Decline as Negative Signals Intensify
Polkadot (DOT) price continues to extend its downtrend, falling below the $1.40 threshold as recorded on Wednesday, following a slight weakening in the previous session. This downward momentum is reinforced by a weakness in derivatives indicators, along with a series of increasingly negative technical signals, indicating ris
TapChiBitcoin31m ago
SOL Is on Its Way to $102 As Ascending Channel Shows Altcoin Ready to Pump 110% Surge: Analyst
Solana (SOL) shows potential for price increase as it stabilizes within an ascending channel, indicating strong buying momentum. Currently priced at $92.48, SOL could rise to $102 if it breaks resistance, with market optimism supported by a bullish index rise.
BlockChainReporter34m ago
BTC Drops 0.57% in 15 Minutes: ETF Capital Deceleration and Derivatives Short Positioning Create Synchronized Selling Pressure
2026-03-25 12:15 to 12:30 (UTC), BTC recorded a -0.57% return within 15 minutes, with price range between 71126.1 to 71751.0 USDT, and amplitude of 0.87%. Market attention increased during this period, with notably intensified volatility, indicating elevated short-term capital participation and shrinking risk appetite.
The primary driver of this movement is the marginal slowdown in ETF capital inflows, weakened buying power in the spot market, and some holders choosing to reduce positions at higher levels. Combined with the derivatives market dominated by short positioning structure, negative funding rates persisting, and longs
GateNews1h ago
ETH drops 0.86% in 15 minutes: On-chain whale transfers and contract long liquidations amplify selling pressure
2026-03-25 12:15 to 12:30 (UTC), ETH experienced a sharp yield decline of -0.86% in an extremely short timeframe, with a price range between 2167.58 to 2191.55 USDT, reaching an amplitude of 1.09%. During this period, market attention surged rapidly, with trading activity and volatility intensifying in sync, resulting in significant short-term price movements that attracted substantial investor focus.
The primary driver of this anomaly was an on-chain whale depositing 13,739 ETH (approximately $28.96 million) in concentrated fashion into a major exchange, triggering sensitive market expectations regarding short-term selling pressure. Immediately following this…
GateNews1h ago
Institution: Circle Stock Price Plunge May Be Misinterpreted, New Stablecoin Regulations Mainly Target Distribution End
Research firm Bernstein points out that the market misinterpreted the Clarity Act draft, causing Circle's stock price to plummet. The bill restricts stablecoin yield distribution, not issuance, so the impact on Circle's business model is limited. In contrast, a certain CEX needs to restructure its revenue mechanism. In the long term, restricting passive income may benefit Circle in consolidating its market position.
GateNews1h ago
