
Date: Fri, Jan 02, 2026 | 10:54 AM GMT
The broader cryptocurrency market has started the new year with modest strength, as both Bitcoin (BTC) and Ethereum (ETH) trade slightly higher with gains of over 2%. This renewed stability across majors has helped improve overall sentiment, allowing several altcoins to regain momentum — including Aster (ASTER).
ASTER is currently trading around 4% higher on the day, but the more important development lies beneath the surface. On lower timeframes, price action is beginning to highlight a constructive bullish structure, suggesting that the token may be preparing for a meaningful breakout if the setup confirms.
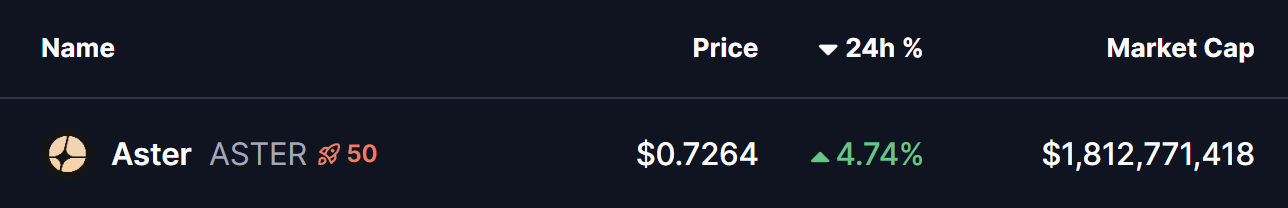
Source: Coinmarketcap
Ascending Triangle Structure Takes Shape
On the 4-hour chart, ASTER is forming a clear ascending triangle, defined by a series of higher lows pressing steadily against a horizontal resistance zone. This type of structure is widely regarded as a bullish continuation pattern, particularly when it develops during consolidation and shows consistent buyer accumulation at rising support levels.
ASTER recently faced rejection near the $0.7367 neckline resistance, which pushed price back toward its ascending support trendline around the $0.68 region. Importantly, each dip has been met with strong buying interest, preventing any deeper pullback and keeping the bullish structure intact. This behavior indicates that sellers are gradually losing control as buyers step in earlier on every retracement.
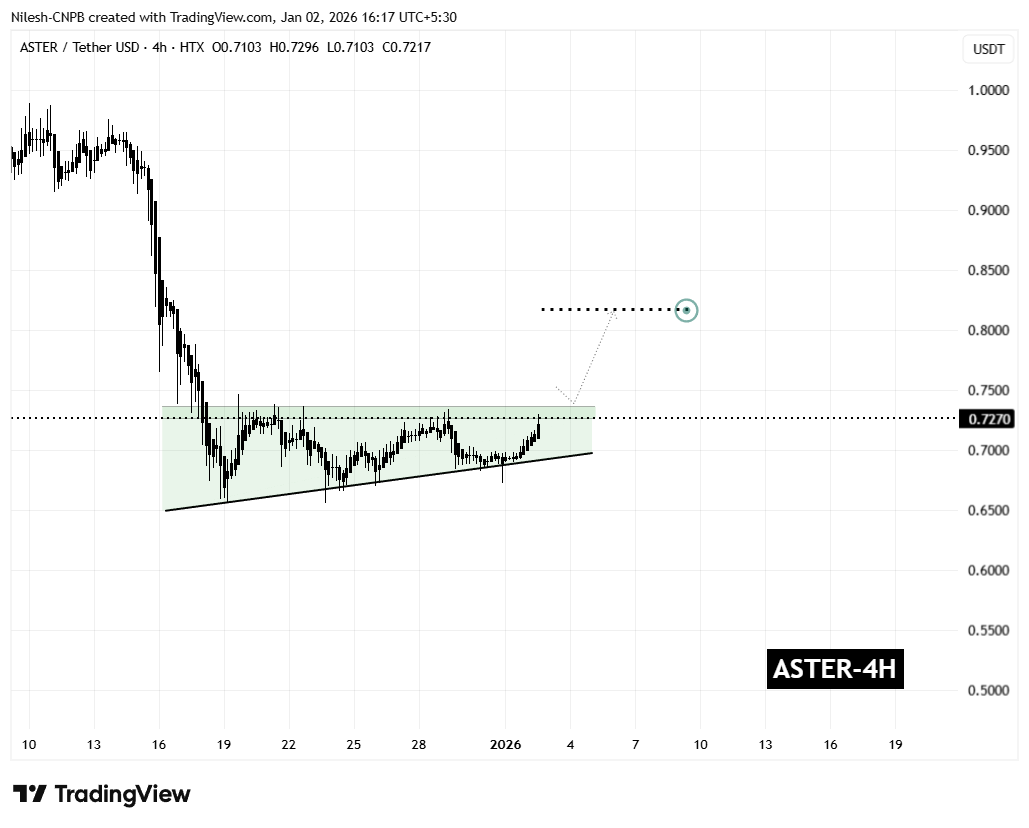
Aster (ASTER) 4H Chart/Coinsprobe (Source: Tradingview)
The latest rebound has once again carried ASTER toward the upper boundary of the triangle, reinforcing the idea that demand remains firm. Rather than signaling weakness, this sideways-to-higher price action reflects healthy consolidation as volatility tightens ahead of a potential breakout.
What’s Next for ASTER?
From here, ASTER appears to be preparing for another test of the $0.7367 resistance zone. A decisive breakout above this level, followed by a sustained close and a successful retest as support, would confirm the ascending triangle pattern and likely trigger a bullish expansion phase.
Based on the measured move of the formation, the technical upside projection points toward the $0.8178 region. This target represents a potential upside of roughly 12% from current levels and also aligns with previous price structure, adding further confidence to the bullish outlook.
That said, caution remains warranted. If ASTER fails to break above resistance, price could once again drift back toward the rising support trendline. As long as this trendline continues to hold, the broader bullish setup remains valid. A decisive breakdown below support, however, would invalidate the pattern and postpone any breakout scenario.
For now, the combination of improving market sentiment, consistent dip-buying, and a tightening ascending triangle structure suggests that Aster is approaching a critical decision point — one that could define its next significant move as 2026 begins.
Disclaimer: The views and analysis presented in this article are for informational purposes only and reflect the author’s perspective, not financial advice. Technical patterns and indicators discussed are subject to market volatility and may or may not yield the anticipated results. Investors are advised to exercise caution, conduct independent research, and make decisions aligned with their individual risk tolerance.
About Author: Nilesh Hembade is the Founder and Lead Author of Coinsprobe, with over 5 years of experience in the cryptocurrency and blockchain industry. Since launching Coinsprobe in 2023, he has been providing daily, research-driven insights through in-depth market analysis, on-chain data, and technical research.
Disclaimer: The information on this page may come from third parties and does not represent the views or opinions of Gate. The content displayed on this page is for reference only and does not constitute any financial, investment, or legal advice. Gate does not guarantee the accuracy or completeness of the information and shall not be liable for any losses arising from the use of this information. Virtual asset investments carry high risks and are subject to significant price volatility. You may lose all of your invested principal. Please fully understand the relevant risks and make prudent decisions based on your own financial situation and risk tolerance. For details, please refer to
Disclaimer.
Related Articles
CFX 4-hour chart reaches a new high for the phase, with approximately 14% increase over 24 hours
Gate News: On March 15, market data shows that CFX reached a new phase high on the 4-hour K-line chart, with prices touching approximately 0.06282 USDT at their peak, representing a 24-hour gain of around 14%. Some community members believe this rally may be related to recent macroeconomic catalysts. Earlier, media outlets citing sources reported that Iran is considering allowing certain tankers to pass through the Strait of Hormuz on the condition that petroleum transport be settled in Chinese yuan. Related discussions have once again sparked market attention toward yuan stablecoins and cross-border payment narratives.
GateNews42m ago
After the network upgrade: What prospects await SOL?
The official approval of protocol SIMD-0266 aims to optimize computing efficiency on the Solana network by introducing p-tokens, simplifying transaction processing. This upgrade, set for April, has prompted increased buying activity and could lead to significant cost reductions and performance improvements.
TapChiBitcoin1h ago
Track FET's journey to the $0.24 milestone as the AI cryptocurrency sector records its most positive trading week in months
The cryptocurrency industry related to AI has recently recorded an impressive performance. According to data from CoinMarketCap, the total market capitalization of this sector has grown 16% in just the past week. Many leading tokens in this category have also achieved significant growth, attracting
TapChiBitcoin2h ago
DeFi enters a "winter of yields": liquidity stagnation, leverage contraction, and the disappearance of arbitrage opportunities
Since September 2025, the DeFi market has entered a "interest rate winter," with the annualized deposit yields of mainstream stablecoins dropping to lows, and supply and demand imbalances causing excess liquidity. As borrowing demand declines, stablecoin lending rates have also decreased, and the reduced risk appetite in the crypto market has led investors to shift toward more stable assets. Some protocols, such as Sky, offer stable returns through real-world assets, but the overall trend still indicates a period of adjustment and structural reform in DeFi.
区块客2h ago
Crypto Analyst and Expert Says Bull Market Is Confirmed as Bitcoin Survives Shakeout
Crypto analyst and expert says bull market is confirmed.
Bitcoin survives a shakeout nd mirrors 2022 price chart.
This shows a positive sign for BTC to set a new ATH price soon.
The crypto market seems to be heading into a strong recovery phase as the price of Bitcoin (BTC) recovers pr
CryptoNewsLand2h ago
Crypto Market Shows Gradual Growth As Top Assets Turn Green
The global crypto market saw a slight increase in total capitalization, while trading volume dropped significantly. Bitcoin and Ethereum prices rose modestly, with notable gains from altcoins like $DOGS, $PI, and $PEPE. DeFi TVL rose slightly, but NFT sales volume fell sharply. Key developments included new investments in gold-related tokens and Aave's launch of Aave Shield to reduce transfer slippage.
BlockChainReporter3h ago