XRP’s price trend in 2025 is not simply sideways consolidation, but more like a deep digestion phase after a high-level rally. Since a strong surge at the beginning of the year that refreshed the all-time high, XRP has released profit-taking pressure through retracements and range-bound consolidation over the past few months. Its overall structure has gradually attracted market attention to the possibility of “history repeating itself.”
Crypto analyst Steph recently shared a chart on the X platform showing that XRP’s current price pattern is highly similar to the long-term consolidation phase before the major rally in 2017. Data indicates that XRP has completed approximately 393 days of sideways trading, nearly identical to the 395-day consolidation phase between 2016 and 2017. This temporal coincidence has led some investors to reassess XRP’s medium- to long-term potential.
In the previous cycle, XRP repeatedly oscillated within a relatively narrow price range for several months, with buying and selling forces in long-term stalemate. Subsequently, the price entered a descending channel structure and broke upward at the channel’s end, initiating a rapid expansion phase. The current XRP trend in 2024-2025 again shows similar features: after a long sideways period, the price re-enters a descending channel and gradually approaches the key lower boundary of the range.
Looking back at historical trends, during 2016-2017, XRP consolidated in the $0.005 to $0.01 range for nearly a year. In early 2017, after breaking out of the descending channel, XRP quickly reclaimed key resistance levels and surged from $0.01 to $0.03 and $0.05, eventually reaching around $0.40 later that year, with a total increase of over 5000%.
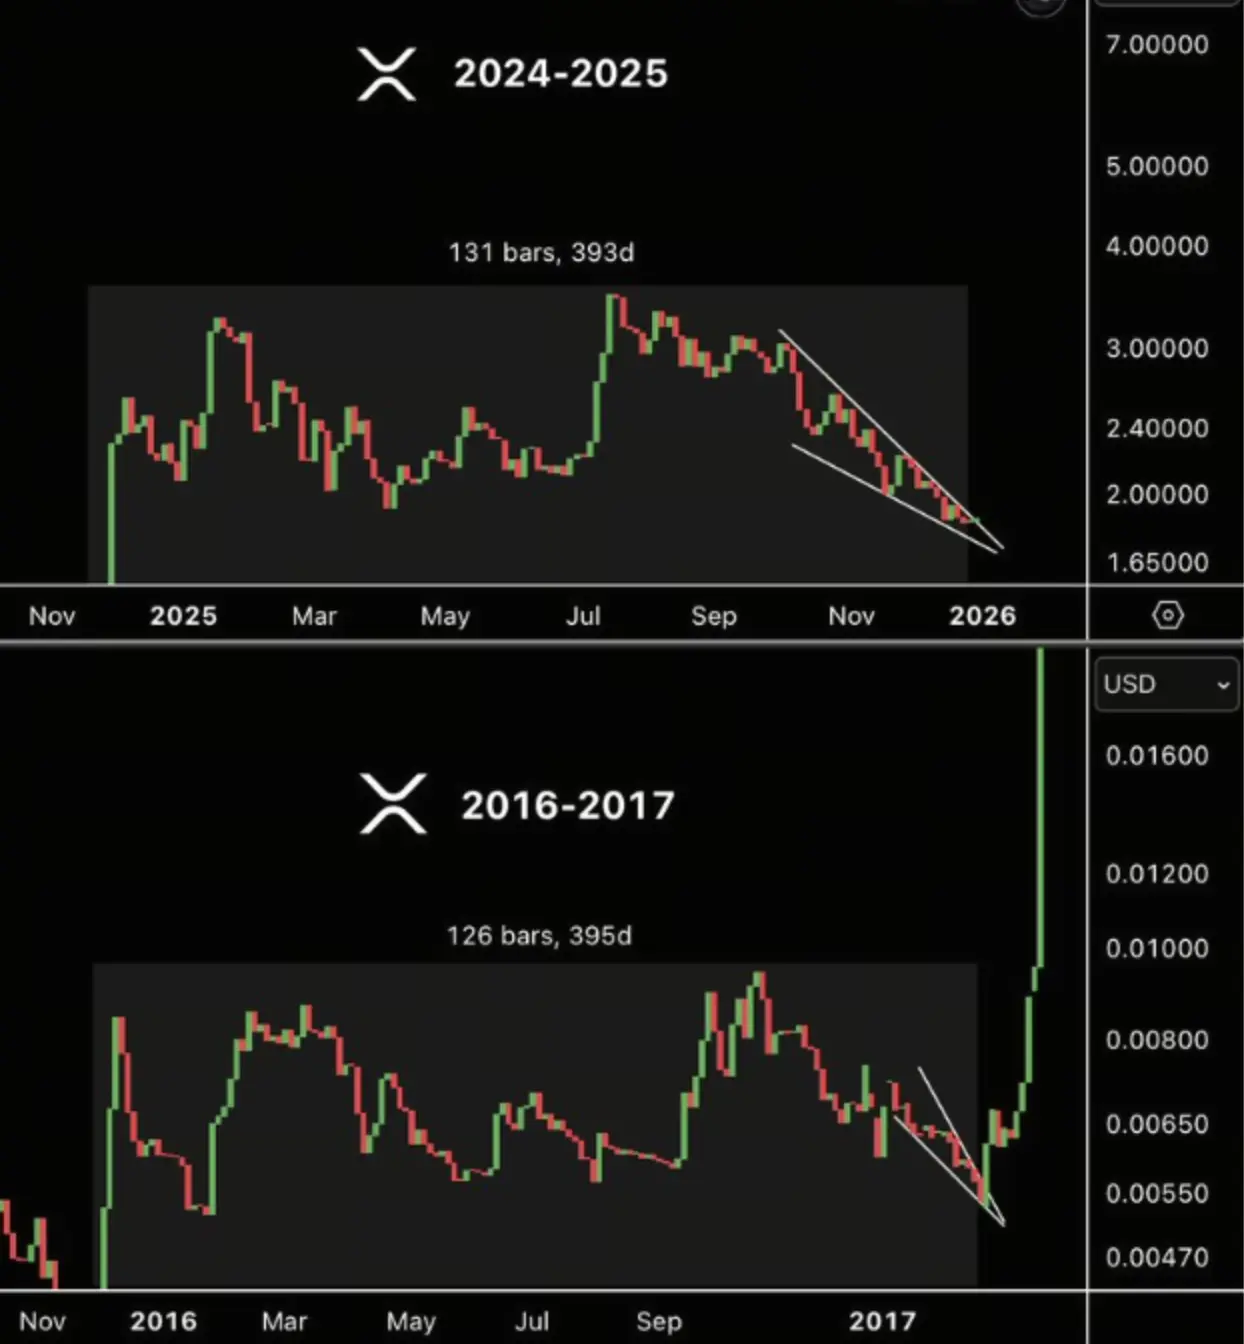
In comparison, during the 2024-2025 cycle, XRP peaked near the $3.40 region before entering sideways consolidation. Currently, the price is within the descending channel and gradually converging toward the $1.70 to $1.90 range. Although market sentiment remains relatively calm, the technical structure is approaching a critical decision point.
Overall, XRP’s current trend in terms of time cycle, consolidation structure, and channel pattern is highly similar to that before the 2017 rally. History does not simply repeat itself, but this structural convergence after a long-term sideways period is becoming a core focus in XRP price forecasts, technical analysis, and medium- to long-term trend discussions.
Disclaimer: The information on this page may come from third parties and does not represent the views or opinions of Gate. The content displayed on this page is for reference only and does not constitute any financial, investment, or legal advice. Gate does not guarantee the accuracy or completeness of the information and shall not be liable for any losses arising from the use of this information. Virtual asset investments carry high risks and are subject to significant price volatility. You may lose all of your invested principal. Please fully understand the relevant risks and make prudent decisions based on your own financial situation and risk tolerance. For details, please refer to
Disclaimer.
