
Key Takeaways
-
SUI has dropped nearly 67% from its recent peak, placing it in a potential bottoming zone.
-
Current price action closely mirrors Solana’s 2025 bottoming fractal, which preceded a strong reversal.
-
A reclaim of the 50-day moving average could confirm a trend shift and open the door for a broader recovery.
SUI, the native token of Sui’s Layer-1 blockchain, has struggled to live up to its early hype in recent months, especially when compared to** Solana’s (SOL)** 2021 explosive performance. A broader market correction has only added pressure, dragging SUI nearly 50% lower over the past 90 days.
But zooming out and looking beneath the surface, the current price structure tells a more interesting story. On the charts, SUI is starting to resemble a bottoming fractal previously seen in Solana—a setup that eventually led to a sharp and sustained upside move.
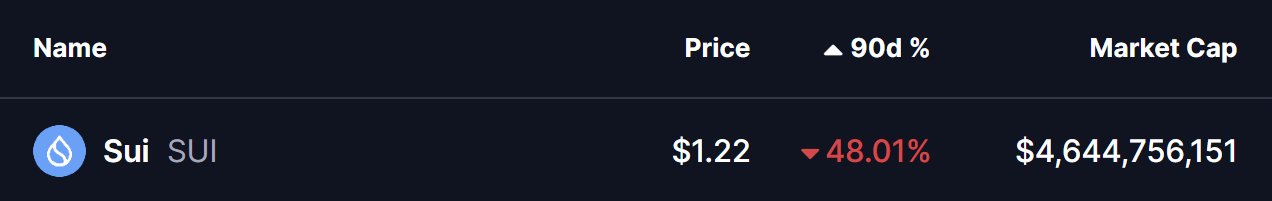
Source: Coinmarketcap
SUI Mirrors SOL’s Bottoming Path
A side-by-side comparison of SUI and SOL reveals striking similarities.
Back in early 2025, **Solana **topped near $295 before entering a sharp corrective phase. Price slipped below the 50-day moving average, signaling weakening momentum. The sell-off eventually stretched into a deep 67% drawdown, flushing out late longs and marking a clear sentiment reset.
That low proved pivotal.
Once SOL reclaimed its 50-day moving average, the trend structure flipped. What followed was a 163% rally, one of the most notable reversals of 2025.
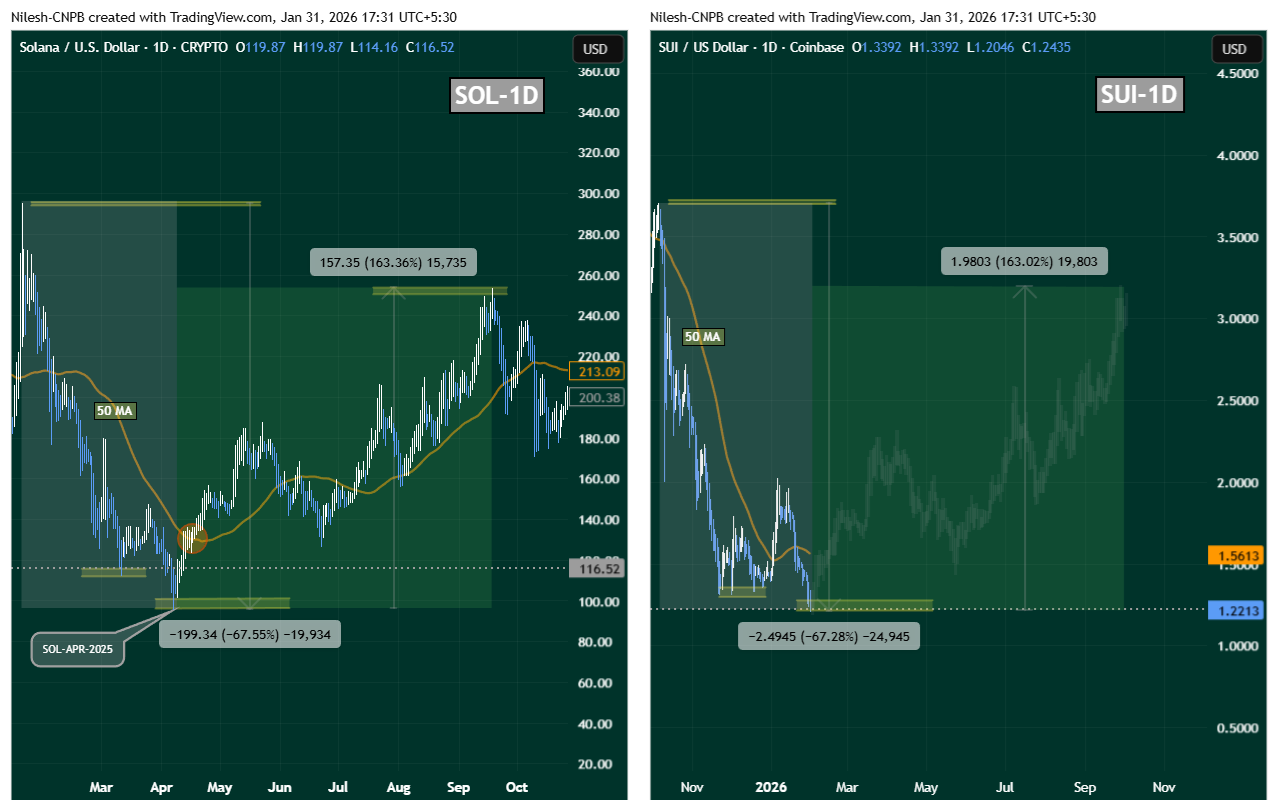
SOL and SUI Fractal Chart/Coinsprobe (Source: Tradingview)
SUI now appears to be following a similar script.
After peaking around $3.70 in October 2025, SUI entered a steep correction, losing its 50-day moving average and sliding into a nearly identical 67% drawdown. Momentum faded, volatility compressed, and price action began to flatten—classic characteristics of a market searching for a base.
What’s Next for SUI?
From a technical perspective, SUI is now sitting near a critical inflection zone around $1.20–$1.22, an area that could act as a potential bottom if buyers continue to defend it.
The first major confirmation bulls will want to see is a reclaim of the 50-day moving average, currently hovering near $1.56. A sustained move above this level would signal that bearish momentum is fading and that buyers are regaining control.
If that reclaim occurs, SUI could transition into a broader recovery phase. In a scenario where the SOL fractal continues to play out, upside expansion toward the $3.00–$3.20 region would come back into focus over the medium term.
Key Risk Note
While fractal comparisons can offer valuable context, they are not guarantees. Each asset trades within its own liquidity environment, sentiment cycle, and macro backdrop. For SUI, confirmation still matters—especially through moving average reclaims and consistent follow-through buying.
Until then, the structure suggests risk is compressing, not expanding.
Disclaimer: The views and analysis presented in this article are for informational purposes only and reflect the author’s perspective, not financial advice. Technical patterns and indicators discussed are subject to market volatility and may or may not yield the anticipated results. Investors are advised to exercise caution, conduct independent research, and make decisions aligned with their individual risk tolerance.
About Author: Nilesh Hembade is the Founder and Lead Author of Coinsprobe, with over 5 years of experience in the cryptocurrency and blockchain industry. Since launching Coinsprobe in 2023, he has been providing daily, research-driven insights through in-depth market analysis, on-chain data, and technical research.
Disclaimer: The information on this page may come from third parties and does not represent the views or opinions of Gate. The content displayed on this page is for reference only and does not constitute any financial, investment, or legal advice. Gate does not guarantee the accuracy or completeness of the information and shall not be liable for any losses arising from the use of this information. Virtual asset investments carry high risks and are subject to significant price volatility. You may lose all of your invested principal. Please fully understand the relevant risks and make prudent decisions based on your own financial situation and risk tolerance. For details, please refer to
Disclaimer.
Gerelateerde artikelen
Spark's Prudent ETH Lending Strategy Proves Justified as Aave Faces Liquidity Crisis Across Multiple Chains
Spark's strategy chief defended maintaining high borrowing rates on SparkLend despite user migration to Aave, citing current market conditions. Aave is experiencing liquidity issues, raising concerns about potential bad debt if ETH prices drop significantly.
GateNewsZojuist
BTC 15分钟上涨0.53%:机构衍生品加仓推动短线反弹
2026-04-20 01:30 至 2026-04-20 01:45(UTC)期间,BTC现货价格在74290.9至74709.7 USDT区间窄幅波动,15分钟内收益率录得+0.53%,振幅0.56%。行情整体波动加剧引发市场关注,但链上活跃地址数平稳,未见极端资金异动。
本次异动的主要驱动力是主流期货平台机构资金流入及衍生品仓位结构调整,尤其CME期货未平仓合约(OI)逆势上涨2.61%
GateNews4u geleden
On-Chain Analyst ZachXBT Flags 6 Altcoins for Suspicious Price Manipulation
On-chain analyst ZachXBT flagged six altcoins (SIREN, MYX, COAI, M, PIPPIN, RIVER) for suspicious price movements akin to the RAVE token case, urging exchanges to act swiftly against market manipulation to protect retail investors.
GateNews8u geleden
BTC 15分钟跌0.44%:ETF资金流出与衍生品空头加仓共振下挫
2026年4月19日21:45至22:00(UTC),BTC价格在15分钟内下挫0.44%,K线区间为74366.1至74789.3 USDT,振幅0.57%。短线波动集中,期间大单成交量显著上升,市场关注度有所提升,波动性加剧。
本次异动的主要驱动力是美国现货比特币ETF在4月18日至19日两日内大额净流出2.91亿美元,反映机构资金短线撤离,造成现货市场抛压显著增加。与此同时,BTC永续合约
GateNews8u geleden
Dogecoin Holds $0.094 as X Cashtags Drive Market Attention
Key Insights
Dogecoin holds above $0.094 despite market weakness as Bitcoin and Ethereum stabilize, reflecting resilience and sustained demand across major cryptocurrencies during the consolidation phase.
X launches smart cashtags enabling real-time crypto and stock tracking, improving marke
CryptoNewsLand11u geleden
Dogecoin Holds $0.09 Support as $0.10 Breakout Looms
Dogecoin remains around $0.09, showing limited movement as traders await a clear breakout direction. Key support is at $0.08, with resistance at $0.10. Current technical indicators suggest a balanced market, but a decisive move is needed to shift momentum.
CryptoNewsLand12u geleden
