
Key Takeaways
-
Algorand (ALGO) is consolidating after a 13% decline over the past 60 days, while showing stabilization in the last month.
-
The daily chart reveals a repeating bullish fractal, similar to the setup that triggered ALGO’s 300% rally in November 2024.
-
Price is holding inside a long-term accumulation zone between $0.11 and $0.1530.
-
The 200-day moving average near $0.1912 is acting as key resistance and breakout confirmation level.
-
A successful reclaim of the 200 MA could open the path toward $0.60 and the ascending resistance trendline, while a drop below $0.11 would invalidate the bullish setup.
ALGO, the native token of Algorand’s Layer-1 blockchain, has shown steady but muted momentum over the past 30 days, helping slow down its broader correction. Despite this stabilization, ALGO remains down more than 13% over the last 60 days, keeping sentiment cautious across the market.
That said, when looking beyond short-term price noise, the daily chart is beginning to tell a familiar story. The current structure closely resembles a bullish fractal that, in the past, preceded a powerful breakout rally—raising an important question for traders: is this just consolidation, or a quiet accumulation phase before the next move?
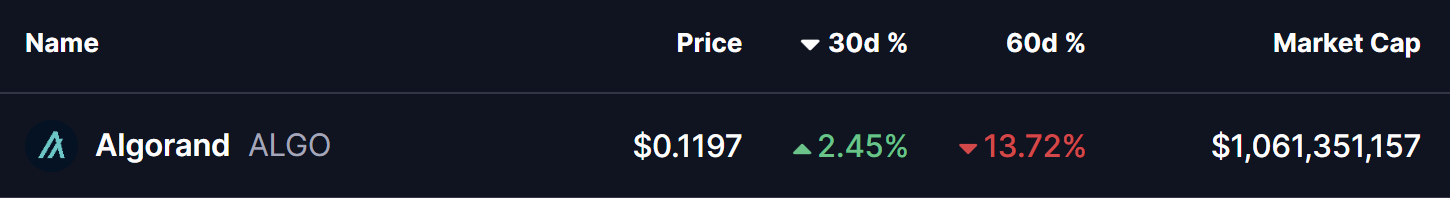
Source: Coinmarketcap
Fractal Setup Hints at a Bullish Reversal
On the daily timeframe, ALGO is displaying early signs of a repeating bullish structure, built around three key technical elements:
-
A rejection from the long-term ascending resistance trendline
-
A prolonged accumulation zone at major historical support
-
A potential reclaim of the 200-day moving average
The current corrective phase began in December 2024, when ALGO was rejected near the ascending resistance trendline around $0.60. That rejection triggered a deep pullback of more than 80%, eventually driving price back into the long-term demand zone between $0.11 and $0.1530—a region that has repeatedly acted as an accumulation area on the chart.
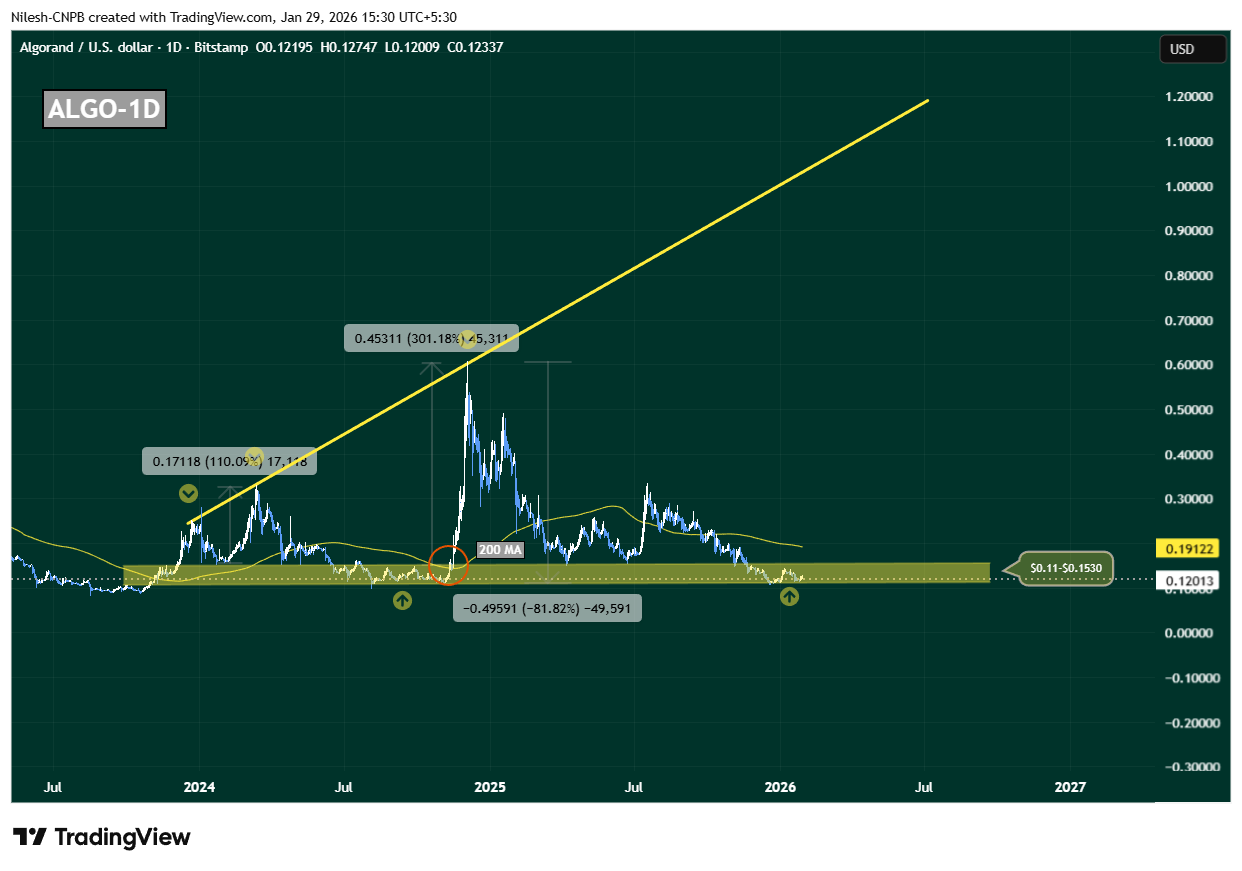
Algorand (ALGO) Daily Chart/Coinsprobe (Source: Tradingview)
This zone is not just technically important; it has also served as a launchpad during previous cycles, where downside momentum stalled and long-term buyers quietly stepped in.
History Rhymes on the ALGO Chart
What makes this setup particularly compelling is how closely it mirrors November 2024’s breakout structure. Back then, ALGO spent extended time consolidating near the same support band before reclaiming the 200-day moving average. Once that level flipped into support, price accelerated sharply—resulting in a 300% rally toward the ascending resistance trendline.
Today, ALGO is once again compressing inside this accumulation range, while the 200-day moving average sits overhead near $0.1912, acting as dynamic resistance. This alignment suggests the market may be approaching another inflection point.
What’s Next for ALGO?
At present, ALGO is hovering near $0.12, firmly inside its long-term accumulation zone. As long as price holds above this region, the broader bullish fractal remains intact.
A clean and sustained reclaim of the 200-day moving average around $0.1912 would be a critical confirmation signal. If bulls manage to flip this level into support, it would closely replicate previous breakout conditions and could trigger a sharp upside expansion. In that scenario, $0.60 becomes a realistic medium-term target, with further upside possible toward the ascending resistance trendline if momentum builds.
However, the structure is not without risk. A decisive breakdown below $0.11 would weaken the accumulation thesis, signal loss of long-term support, and open the door for deeper downside.
For now, ALGO sits at a make-or-break zone. The chart suggests patience is key—but if history repeats, this quiet phase may not last much longer.
Disclaimer: The views and analysis presented in this article are for informational purposes only and reflect the author’s perspective, not financial advice. Technical patterns and indicators discussed are subject to market volatility and may or may not yield the anticipated results. Investors are advised to exercise caution, conduct independent research, and make decisions aligned with their individual risk tolerance.
About Author: Nilesh Hembade is the Founder and Lead Author of Coinsprobe, with over 5 years of experience in the cryptocurrency and blockchain industry. Since launching Coinsprobe in 2023, he has been providing daily, research-driven insights through in-depth market analysis, on-chain data, and technical research.
Disclaimer: The information on this page may come from third parties and does not represent the views or opinions of Gate. The content displayed on this page is for reference only and does not constitute any financial, investment, or legal advice. Gate does not guarantee the accuracy or completeness of the information and shall not be liable for any losses arising from the use of this information. Virtual asset investments carry high risks and are subject to significant price volatility. You may lose all of your invested principal. Please fully understand the relevant risks and make prudent decisions based on your own financial situation and risk tolerance. For details, please refer to
Disclaimer.
Gerelateerde artikelen
Hoskinson Calls Clarity Act 'Insanity,' Says It Would Classify XRP as Security
Charles Hoskinson, founder of Cardano, stated in an interview that the Clarity Act in its current form would classify XRP, Ethereum, and ADA as securities if those projects were founded today, contradicting celebrations from the XRP community over the bill's passage.
The Security Trap Mechanism
H
CryptoFrontier6m geleden
XRP Price Nears $1.50 Breakout as Triangle Tightens
Abstract: XRP is trading within a tightening symmetrical triangle, indicating a potential bullish breakout as momentum builds. A green Supertrend and rising MACD support the case, with price near $1.41 and resistance at $1.50 and support at $1.20. A break above $1.50 could target around $1.61; a break below $1.20 could drive toward $1.00, all amid cautious market conditions.
Summary: XRP is consolidating in a tightening symmetrical triangle near $1.41, with bullish momentum as Supertrend turns green and MACD rises. A breakout above $1.50 could target $1.61, while a drop below $1.20 risks $1.00.
CryptoNewsLand44m geleden
Shiba Inu Price Compression Signals Imminent Breakout Phase
Key Insights:
Shiba Inu trades near $0.0000060 as tightening volatility and reduced momentum signal an approaching breakout phase after months of sustained decline.
Open interest declines to $68 million, while persistent spot outflows highlight cautious sentiment and limited conviction
CryptoNewsLand47m geleden
Solana Price Holds Range as $90 Resistance Caps Breakout
Key Insightsthe price
Solana trades between $85 and $86 after a pullback, while an ascending channel pattern supports bullish structure with strong demand near support levels.
Momentum indicators, including MACD and Aroon, suggest strengthening buying pressure, reinforcing expectations of a
CryptoNewsLand56m geleden
ARK 2026 比特幣展望:ETF + DAT 佔 12% 供應、2030 加密市值估 28 兆
ARK Big Ideas 2026 指出,機構採用加速、ETF+DAT合併已掌握BTC 12%流通供應,政府與州政府陸續買入形成長期支撐。2025年回檔史上最低,波動性下降。2030市值約28兆美元,BTC約4.2兆,年增長60-61%。新興市場穩定幣取代部分BTC儲蓄需求,長線投資者應以結構性買盤與風險控管為主。
ChainNewsAbmedia1u geleden
Ethereum Outperforms S&P 500 by 1,696 Basis Points Since U.S.-Iran Conflict, Says Tom Lee
Gate News message, April 27 — Tom Lee, chairman of Bitmine, stated that Ethereum has outperformed the S&P 500 index (U.S. benchmark equity index) by 1,696 basis points since the U.S.-Iran conflict, making it the best-performing single asset globally aside from crude oil. According to Lee, ETH has de
GateNews2u geleden